刚刚接触压力测试不久,分享一些自己的体会,可能会有疏漏,欢迎诸位专家多多指教。
背景
痛点如下:
1.老板和研发总会问测试 我们产品当前版本与过去版本相比性能是变好了,还是变坏了?
2.知道了我们产品性能指标变化之后,他们还要关心我们产品与竞争对手产品之间的性能差异?
3.当我们进行了压力测试,得出一个相对较差的成绩之后,研发同学会质疑较差的压测结果是由于测试方法或者测试环境导致的;
4.最痛苦的就是研发会有一种欲望,就是每次提交代码之后,都想立刻看看压测结果是不是会变好一些了。
最初的做法,我们是用 ab 压测一个常用的应用页面,估计出一个适中的并发数,然后执行压测,这个步骤并不困难,也很省时间;
后来这种方法被质疑,光压一个并发数不合理;因为服务器在某一个并发数下的表现,不能代表性能的整体平均表现。需要有一个由小变大的过程,就是压测脚本需要做一个并发数增量循环,比如并发 from 1 to 500;然后把响应数据加和平均;于是痛苦的日子开始了,利用 ab 进行递增压测,然后从 ab 的压测报告中,抠出有用的数据,导入 excel 表,进行汇总 取平均;每次都要测出我们自己产品的新版、旧版、竞争对手的压测数据,然后算出汇总平均值,过程很费时间,没有 1 个半小时绝对无法搞定。
灵感
上述过程虽然痛苦,但是有一个很明显可以自动化的特征,就是每次的 “劳动” 步骤非常的单调和重复;简单描述可以用下图表示:
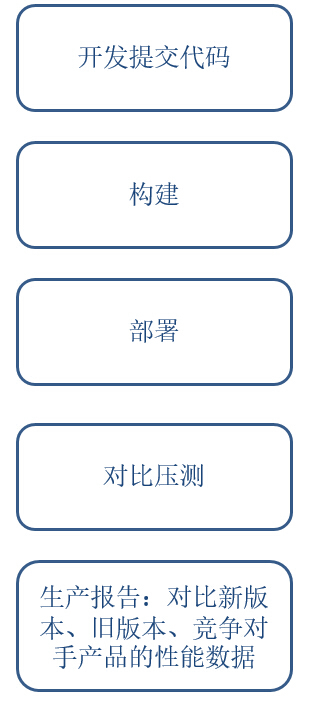
如果能够实现自动化,那么每次测试的过程是由程序控制,人干预的因素大大降低,只要自动测试代码被认可,测试结果能被质疑的成分大大降低。同时,自动化是累机器,人可以 100% 的解放出来。机器最擅长做重复性劳动,保证又快又好。
工具选型
- 肯定希望把这个压测小工具集成进 jenkins,这是团队成员非常喜欢的一款东东;
- 对于控制代码可以用 shell 进行编写;
- 发压工具是 ab;
- 有一点不甘心的地方是 我希望自动压测之后出来的 report 能相对 “高大上”,可读性相对较强,最好能图形化;最终在高人指点下,选择了 python 的 tornado.template,作为 report 生成工具。
实现流程图
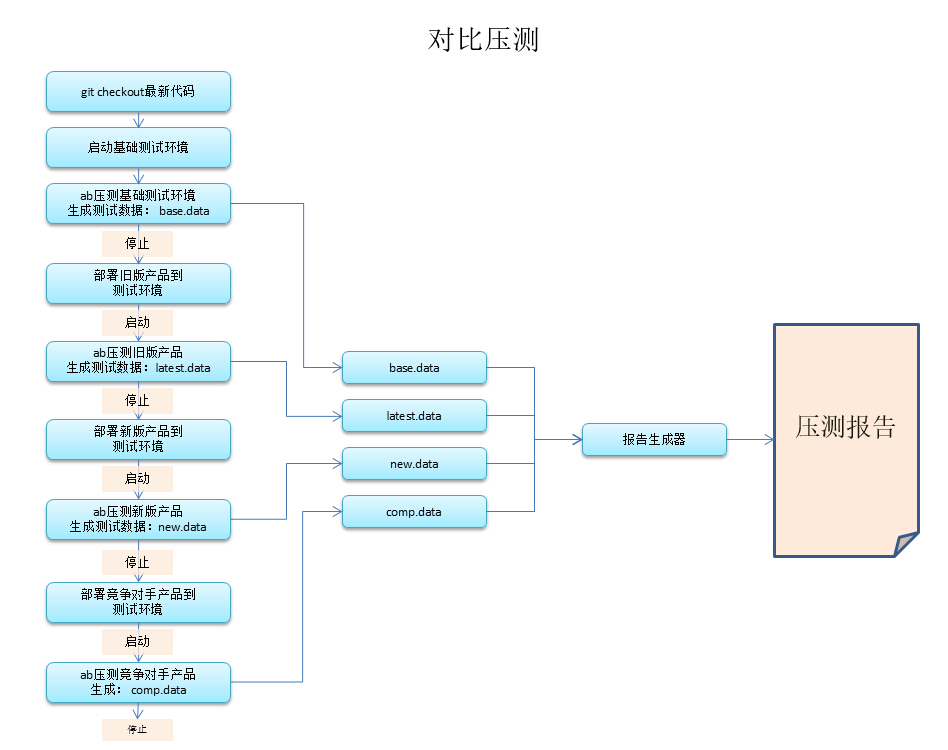
需要说明的是,压测过程中,ab 产生的压测报告,需要利用 python 进行解析,然后生成测试数据 *.data 文件;测试数据都生成之后,再利用 python 的 tornado.template 生成带有对比曲线图的测试报告。压测 job 健在 jenkins 中,利用参数传入每次压测使用的代码分支和最大并发数,然后一键运行即可。
实现样子
Jenkins Job

压测报告
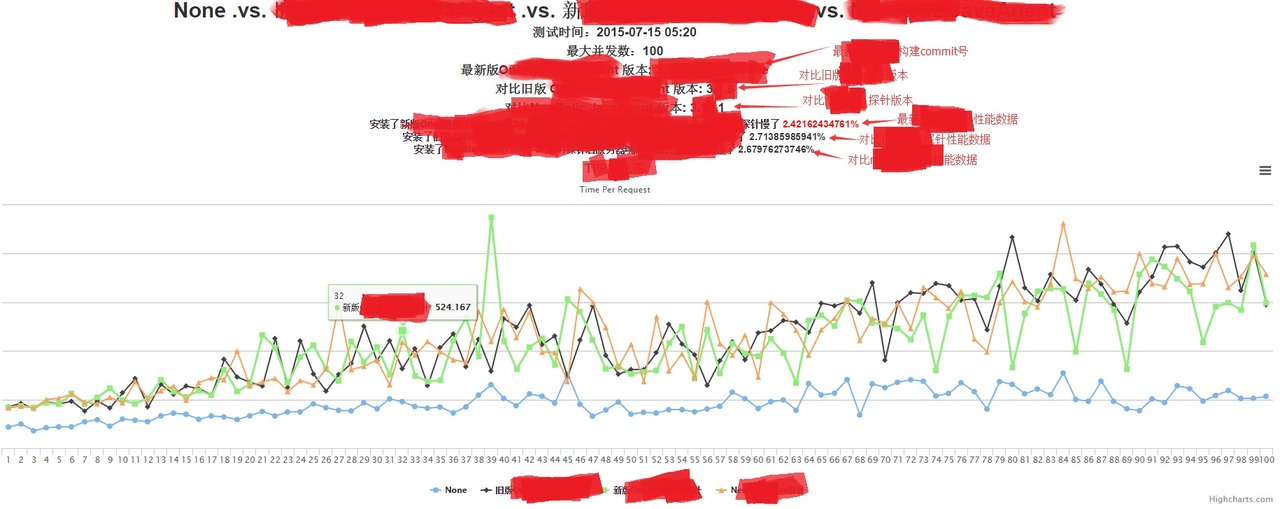
实现结果
实现了这个自动对比压测之后,每次运行这个压测程序,在最大 100 并发的情况下,大约需要 30 分钟左右;运行速度比人快很多,而且不需要人工干预,极大解放了人力。
源代码
下面代码作为参考,大家可以利用 shell 把它集成到 jenkins 中去运行实现 CI 自动化
考虑到公司机密,代码会做一些修改,基本功能保持不变;其中 PCompare.py 是对比发压的程序,PReport.py 是 report 生成器, Report_.html 是测试报告模板。
PCompare.py
import ConfigParser
import os
import sys
import commands
import re

class ConfigReader:

    def __init__(self, confname):
        self.confname = confname
        self.cf = ConfigParser.ConfigParser()
        self.cf.read(self.confname)
        self.table_num = 0
        self.url = ''
        self.clist = []
        self.nlist = []

    def parser(self):
        section = "base"
        self.url = self.cf.get(section, "url")
        self.CMODE = self.cf.get(section, "CMODE")
        self.clist = set(self.cf.get(section, "clist").split(','))
        self.nlist = set(self.cf.get(section, "nlist").split(','))


class DoTest:

    def __init__(self, cfr):
        self.conf = cfr
        self.result = {}

    def one_test(self, cnum, nnum):
        cmd = 'ab -c %d -n %d %s' %(cnum, nnum, self.conf.url)
        status,output = commands.getstatusoutput(cmd)
        ab_result = {'tpr' : 0, 'rps': 0}
        if status == 0:
            tpr_pattern = "Time per request\:       \d+.\d+"
            rps_pattern = "Requests per second:    \d+.\d+"
            try:
                m = re.search(tpr_pattern, output).group()
                tpr = m.split(':')[1].strip()
            except:
                print 're error in %s' %(tpr_pattern)
            try:
                m = re.search(rps_pattern, output).group()
                rps = m.split(':')[1].strip()
            except:
                print 're error in %s' %(rps_pattern)
            ab_result['tpr'] = tpr
            ab_result['rps'] = rps
        return ab_result

    def all_test(self,t_max):
        if self.conf.CMODE == 'on':
            clist = self.conf.clist
        else:
            clist = range(1,t_max)

    for num in clist:
            num = int(num)
            one_result = self.one_test(num, num*10)
            self.result[num] = one_result
        return self.result

if __name__ == '__main__':
    cfr = ConfigReader(sys.argv[1])
    cfr.parser()
    t_max = int(sys.argv[2]) + 1
    abtest = DoTest(cfr)
    abtest.one_test(5,10)
    print abtest.all_test(t_max)
PReport.py
import sys
import time
import datetime
import json
import tornado.template
class gen_report:

    def __init__(self):
        self.conf = {}
        self.data = {}

    def get_oridata(self):
        base_data = eval(file('./base.data','r').read())
        latest_data = eval(file('./latest.data','r').read())
        new_data = eval(file('./new.data','r').read())
        comp_data = eval(file('./comp.data','r').read())
        self.data['ori'] = base_data
        self.data['latest'] = latest_data
        self.data['new'] = new_data
        self.data['comp'] = comp_data
        self.data['x'] = range(1, len(base_data)+1)
        self.data['ori_tpr'] = []
        self.data['ori_rps'] = []
        self.data['latest_tpr'] = []
        self.data['latest_rps'] = []
        self.data['new_tpr'] = []
        self.data['new_rps'] = []
        self.data['comp_tpr'] = []
        self.data['comp_rps'] = []
        for i in self.data['x']:
            self.data['ori_tpr'].append(float(base_data[i]['tpr']))
            self.data['ori_rps'].append(float(base_data[i]['rps']))
            self.data['latest_tpr'].append(float(latest_data[i]['tpr']))
            self.data['latest_rps'].append(float(latest_data[i]['rps']))
            self.data['new_tpr'].append(float(new_data[i]['tpr']))
            self.data['new_rps'].append(float(new_data[i]['rps']))
            self.data['comp_tpr'].append(float(comp_data[i]['tpr']))
            self.data['comp_rps'].append(float(comp_data[i]['rps']))

        self.data['latest_tpr_slow'] = (sum(self.data['latest_tpr']) - sum(self.data['ori_tpr']))*100/\
                                        sum(self.data['ori_tpr'])
        self.data['new_tpr_slow'] = (sum(self.data['new_tpr']) - sum(self.data['ori_tpr']))*100/\
                                        sum(self.data['ori_tpr'])
        self.data['comp_tpr_slow'] = (sum(self.data['comp_tpr']) - sum(self.data['ori_tpr']))*100/\
                                        sum(self.data['ori_tpr'])

        return self.data

    def generate(self):
        loader = tornado.template.Loader("./")
        t = loader.load("PReport_java.html")
        self.conf = self.get_oridata()
        html = t.generate(static_url="../static",conf=self.conf)
        today = datetime.datetime.fromtimestamp(time.time()).strftime("%Y-%m-%d")
        f = open("./PReport/PReport_%s.html"%(today),"w")
        f.write(html)

if __name__ == '__main__':
    d = gen_report().get_oridata()
    gen_report().generate()
    print d
Report_.html
<!DOCTYPE html>
<html>
<head>
    <meta charset="utf-8">
    <title> PerformTest</title>
    <meta name="viewport" content="width=device-width, initial-scale=1.0">
    <meta name="description" content="">
    <!-- The secondlist -->
    <link rel="stylesheet" type="text/css" href="http://static.hcharts.cn/css/bootstrap.min.css">
    <script type="text/javascript" src="http://static.hcharts.cn/jquery/jquery-2.0.2.min.js"></script>
    <script type="text/javascript" src="http://www.hcharts.cn/demo/js/highcharts.js"></script>
    <script type="text/javascript" src="http://www.hcharts.cn/demo/js/exporting.js"></script>

    </head>
<body>

{% set table_high = len(conf['ori']) %}
<h1 align="center">None .vs. 旧版 .vs. 新版 .vs. comp</h1>
<h3 align="center">测试时间:testTime</h3>
<h3 align="center">最大并发数:t_max</h3>
<h3 align="center">最新版  版本: <a style="color:red"> new__version</a></h3>
<h3 align="center">对比旧版   版本: base__version</h3>
<h3 align="center">对比竞争对手  版本: comp_version</h3>
<h4 align="center">安装了新版(Version: new__version)后服务器响应速度比不装慢了 <a style="color:red">{{conf['newer__tpr_slow']}}%</a></h4>
<h4 align="center">安装了旧版(Version: base__version)后服务器响应速度比不装慢了 {{conf['base__tpr_slow']}}%</h4>
<h4 align="center">安装了 (Version: _version)后服务器响应速度比不装慢了 {{conf['comp_tpr_slow']}}%</h4>

    <div id="tpr" style="height: 500px; min-width: 600px"></div>
    <div id="rps" style="height: 500px; min-width: 600px"></div>

<h2>详细数据</h2>
        <table class="table table-bordered table-striped">
            <thead>
                <tr>
                <th>并发数</th>
                <th>没有-RPS</th>
                <th>旧版-RPS</th>
                <th>新版-RPS</th>
                <th>comp-RPS</th>
                <th>没有-TPR</th>
                <th>旧版-TPR</th>
                <th>新版-TPR</th>
                <th>comp-TPR</th>
                </tr>
          </thead>
          <tbody>
           {% for i in range(1, table_high+1) %}
           <tr>
                <th>{{i}}</th>
                <th>{{conf['ori'][i]['rps']}}</th>
               <th>{{conf['base_'][i]['rps']}}</th>
               <th>{{conf['newer_'][i]['rps']}}</th>
               <th>{{conf['comp'][i]['rps']}}</th>
               <th>{{conf['ori'][i]['tpr']}}</th>
               <th>{{conf['base_'][i]['tpr']}}</th>
               <th>{{conf['newer_'][i]['tpr']}}</th>
               <th>{{conf['comp'][i]['tpr']}}</th>
           </tr>
           {% end%}
          </tbody>
          </table>


<script type="text/javascript">
$(function () {
    $('#rps').highcharts({
        chart: {
            type: 'line'
        },
        title: {
            text: 'RPS对比图'
        },
        subtitle: {
            text: 'Request Per Second'
        },
        xAxis: {
            categories: {{conf['x']}}
        },
        yAxis: {
            title: {
                text: 'nums/sec'
            }
        },

    plotOptions: {
        spline: {
            lineWidth: 1.5,
            fillOpacity: 0.1,
             marker: {
                enabled: false,
                states: {
                    hover: {
                        enabled: true,
                        radius: 2
                    }
                }
            },
            shadow: false
        }
    },
        series: [{
            name: 'None',
            data: {{conf['ori_rps']}}
        }, {
            name: '旧版 ',
            data: {{conf['base__rps']}}
        },{
            name: '新版 ',
            data: {{conf['newer__rps']}}
        },{
            name: 'comp ',
            data: {{conf['comp_rps']}}
        }]
    });
});


$(function () {
    $('#tpr').highcharts({
        chart: {
            type: 'line'
        },
        title: {
            text: 'TPR对比图'
        },
        subtitle: {
            text: 'Time Per Request'
        },
        xAxis: {
            categories: {{conf['x']}}
        },
        yAxis: {
            title: {
                text: 'response (ms)'
            }
        },
        plotOptions: {
        spline: {
            lineWidth: 1.5,
            fillOpacity: 0.1,
             marker: {
                enabled: false,
                states: {
                    hover: {
                        enabled: true,
                        radius: 2
                    }
                }
            },
            shadow: false
        }
    },
        series: [{
            name: 'None',
            data: {{conf['ori_tpr']}}
        }, {
            name: '旧版 ',
            data: {{conf['base__tpr']}}
        },{
            name: '新版 ',
            data: {{conf['newer__tpr']}}
        },{
            name: 'comp ',
            data: {{conf['comp_tpr']}}
        }]
    });
});
</script>


</body>
</html>