移动性能测试 关于 android 通过 python 统计 fps

benlee · 2015年01月23日 · 最后由 kksylgmm 回复于 2022年08月11日 · 6995 次阅读
本帖已被设为精华帖!

用了这个第三方库
https://github.com/ChromiumWebApps/chromium/tree/master/build/android/pylib

然后如下代码:

# -*- coding: utf8 -*-
import os, time#, sys
from pylib import android_commands, surface_stats_collector

resultList = []
deviceText = os.popen('adb devices')
textList = deviceText.readlines()
deviceName = textList[1].split()[0]
adb = android_commands.AndroidCommands(deviceName)
collector = surface_stats_collector.SurfaceStatsCollector(adb, activityName,0.5)
collector.DisableWarningAboutEmptyData()
collector.Start()
for i in range(50):    #循环50次,主要方便自己的实现,其他实现方法请另行实现;
    time.sleep(0.3)
    results = collector.SampleResults()
    if not results:
        pass
    else: 
        resultList.append(int(results[0].value))
        results[0].print_str()
collector.Stop()
a = resultList[3:-3]
print u"平均值:"+str(float(sum(a)/len(a)))+u" ; 最小值:"+str(min(a))

代码写得不怎的,请无视。

运行上述脚本,在对应的 activity 操作,即可统计当前操作的 fps 值了。

跑一边看看:

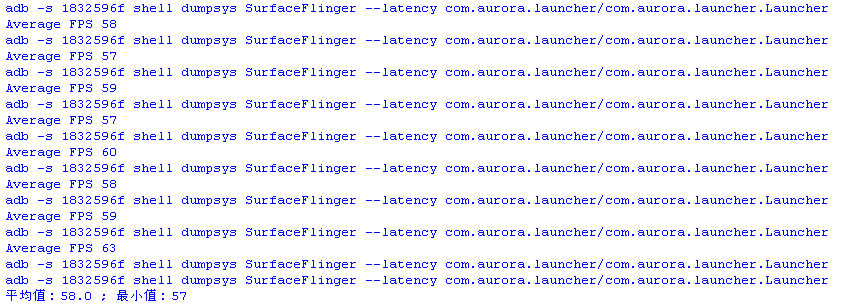
看库的源码,原理是使用"adb shell dumpsys SurfaceFlinger --latency "进行循环统计实现的。

代码中有如下注释:

def _GetSurfaceFlingerFrameData(self):
    """Returns collected SurfaceFlinger frame timing data.

    Returns:
      A tuple containing:
      - The display's nominal refresh period in seconds.
      - A list of timestamps signifying frame presentation times in seconds.
      The return value may be (None, None) if there was no data collected (for
      example, if the app was closed before the collector thread has finished).
    """
    # adb shell dumpsys SurfaceFlinger --latency <window name>
    # prints some information about the last 128 frames displayed in
    # that window.
    # The data returned looks like this:
    # 16954612
    # 7657467895508   7657482691352   7657493499756
    # 7657484466553   7657499645964   7657511077881
    # 7657500793457   7657516600576   7657527404785
    # (...)
    #
    # The first line is the refresh period (here 16.95 ms), it is followed
    # by 128 lines w/ 3 timestamps in nanosecond each:
    # A) when the app started to draw
    # B) the vsync immediately preceding SF submitting the frame to the h/w
    # C) timestamp immediately after SF submitted that frame to the h/w
    #
    # The difference between the 1st and 3rd timestamp is the frame-latency.
    # An interesting data is when the frame latency crosses a refresh period
    # boundary, this can be calculated this way:
    #
    # ceil((C - A) / refresh-period)
    #
    # (each time the number above changes, we have a "jank").
    # If this happens a lot during an animation, the animation appears
    # janky, even if it runs at 60 fps in average.
    #
    # We use the special "SurfaceView" window name because the statistics for
    # the activity's main window are not updated when the main web content is
    # composited into a SurfaceView.
    results = self._adb.RunShellCommand('dumpsys SurfaceFlinger --latency ' + self._activity)
    if not len(results):
      return (None, None)

英语烂,脑容量有限,一直看不明白,有大神帮帮忙解析一下哈(原谅我伸手党)。

共收到 32 条回复 时间 点赞

好文~mark,晚上来看下~~

循环 50 次, 间隔 0.3s, 得到 50 个数据。然后掐头去尾, 计算下平均值。好像是大概 10s 内的 fps 平均值。
adb shell dumpsys SurfaceFlinger 本身能打印出 fps 里面会有更细致的帧数计算数据。细节我也了解的不太多。

surface_stats_collector.SurfaceStatsCollector 函数里面应该有你想要的逻辑。 你可以帖一下欣赏下。

一般某个过程发生了丢帧, 是在几秒内的, 10s 有点太长, 不过还可以接受. 大部分的卡顿都在 2s 以上. 10s 内平均也能差不多通过平均值看出来.

#2 楼 @seveniruby
1、间隔 0.3 秒是因为从 操作->画帧开始->画帧结束 这个过程小于 1 秒完成的,为了数据能够覆盖画帧整个过程,所以设置 0.3 秒(其实这样可能不准)。然后我针对结果掐头去尾,我不仅统计了平均值,也计算最小值,也就是掉帧掉到什么程度。这个会是报告一个标准值。
2、我看了 surface_stats_collector.SurfaceStatsCollector 函数,其实就是我上面贴的源码。完整版如下:

def _GetSurfaceFlingerFrameData(self):
    """Returns collected SurfaceFlinger frame timing data.

    Returns:
      A tuple containing:
      - The display's nominal refresh period in seconds.
      - A list of timestamps signifying frame presentation times in seconds.
      The return value may be (None, None) if there was no data collected (for
      example, if the app was closed before the collector thread has finished).
    """
    # adb shell dumpsys SurfaceFlinger --latency <window name>
    # prints some information about the last 128 frames displayed in
    # that window.
    # The data returned looks like this:
    # 16954612
    # 7657467895508   7657482691352   7657493499756
    # 7657484466553   7657499645964   7657511077881
    # 7657500793457   7657516600576   7657527404785
    # (...)
    #
    # The first line is the refresh period (here 16.95 ms), it is followed
    # by 128 lines w/ 3 timestamps in nanosecond each:
    # A) when the app started to draw
    # B) the vsync immediately preceding SF submitting the frame to the h/w
    # C) timestamp immediately after SF submitted that frame to the h/w
    #
    # The difference between the 1st and 3rd timestamp is the frame-latency.
    # An interesting data is when the frame latency crosses a refresh period
    # boundary, this can be calculated this way:
    #
    # ceil((C - A) / refresh-period)
    #
    # (each time the number above changes, we have a "jank").
    # If this happens a lot during an animation, the animation appears
    # janky, even if it runs at 60 fps in average.
    #
    # We use the special "SurfaceView" window name because the statistics for
    # the activity's main window are not updated when the main web content is
    # composited into a SurfaceView.
    results = self._adb.RunShellCommand('dumpsys SurfaceFlinger --latency ' + self._activity)
    if not len(results):
      return (None, None)

    timestamps = []
    nanoseconds_per_second = 1e9
    refresh_period = long(results[0]) / nanoseconds_per_second

    # If a fence associated with a frame is still pending when we query the
    # latency data, SurfaceFlinger gives the frame a timestamp of INT64_MAX.
    # Since we only care about completed frames, we will ignore any timestamps
    # with this value.
    pending_fence_timestamp = (1 << 63) - 1

    for line in results[1:]:
      fields = line.split()
      if len(fields) != 3:
        continue
      timestamp = long(fields[1])
      if timestamp == pending_fence_timestamp:
        continue
      timestamp /= nanoseconds_per_second
      timestamps.append(timestamp)
    return (refresh_period, timestamps)

这是分享知识的帖还是寻求帮助的帖?

benlee #10 · 2015年01月25日 Author

#5 楼 @doctorq 一半分享,一半寻求帮助吧。。哈哈
看了你博客的大作。点赞。

#6 楼 @sziitash 我和小 A 正在追踪这个获取方式的具体细节,写完后给看看对不对

#6 楼 @sziitash 经过分析得出的结论如下:
要想获得获取 fps 值,需要 3 步:

1.adb shell dumpsys SurfaceFlinger --latency 命令产生 fps 数据.
2.通过 service call SurfaceFlinger 1013 来得到当前帧的索引以及时间戳,设置为 A = {indexA,timeA}.
3.公式:
设上一次的数据为 B = {indexB,timeB}
FPS = (indexA-indexB)/(timeA-timeB)
具体分析过程请看Android 性能测试之 fps 获取 ,感谢@qddegtya的帮忙

@doctorq 看了博客的详细分析,感觉缺少几点。第一个关于 jank(掉帧)的计算、第二个是 fps 的获取方法你描述的只是其中的一种 最终帧率=获取到的帧率 - 掉帧 其中获取到的帧率用的为这个公式 int(round((frame_count - 1) / seconds)) 这里会产生 2 个不同点,第一个是关于 frame_count 的获取,另外一个是关于 seconds 的获取,假设被测机型允许 latency(--latency-clear)命令时就会使用博主所说的,如果不允许就通过 (refresh_period, timestamps) = self._GetDataFromThread() 上述 2 个参数实际还是通过_GetSurfaceFlingerFrameData 来获得

#9 楼 @kasi kasi 前辈,
1.你的意思是当允许使用--latency-clear 命令时候,该帖所使用的方法才有作用。也就是service call SurfaceFlinger 1013才会起作用。
2.如果--latency-clear 不能使用的时候,还是得通过_GetSurfaceFlingerFrameData来得到。
3.但是不管采用上面方法的任何一种,得到的 fps 值,还需要减去 jank(掉帧)。即 (fps-jank) 才是正确 fps 的值。
4.所以我还需要知道 jank 的计算,以及第二种情况下 fps 的计算方法。
5.第一种方式计算获取到的 fps 也是有问题的,得改成下面的公式,在原来的基础上-1
FPS = (indexA-indexB-1)/(timeA-timeB)
不知道理解的对不?还望前辈指点

@doctorq 恩 jank 一般是基于第二种才计算的,jank 的计算会用到 jackinees,这个是通过_GetNormalizedDeltas 这个获得的,然后通过来得到最终数值

sum(1 for change in jankiness
                     if change > 0 and change < pause_threshold)

第一种还是你之前的那种计算是对的,不需要额外-1 的 我上面的那个公式还是不对的,那个只是对第二种帧率用的,如果是第一种计算公式应该是

int(rount(frame_count/seconds))

#11 楼 @kasi ok,谢谢卡斯前辈指点,我的疑惑没了。感谢

#11 楼 @kasi 前辈,我把上面说的几点添加到博客了,但是有一个地方不明白,好像没有 jank 的值,

jankiness = [max(0, round(change)) for change in normalized_changes]
pause_threshold = 20
jank_count = sum(1 for change in jankiness
if change > 0 and change < pause_threshold)

只有 jank_count 也就是掉帧的次数。 看它的解释好像是说,jank 是一种状态,就是当前帧的数据通过下面公司得到的数值与之前行的数值发生改变,说明该帧属于掉帧。

# ceil((C - A) / refresh-period)
#
# (each time the number above changes, we have a "jank").
# If this happens a lot during an animation, the animation appears
# janky, even if it runs at 60 fps in average.

@doctorq 恩,对的 jank_count 实际上就是统计的 ceil((C - A) / refresh-period) 发生差异的次数,所以用软件的方式来计算最终 fps 的话 还需要排除掉这个因素的的影响,但实际测试过程中都是用的第一种取帧率的方法,基本没有去读取到 jank_count,跟采用高速相机测试就会有一定的偏差

#14 楼 @kasi 恩,看了你写的 android 性能合集,上面你推荐使用的方法就是高速相机的测试方法。我对性能方面的测试比较感兴趣,以后还望前辈多多给予指点

读了你的帖子,特意去尝试了下。已经下载了 pylib 的源码,但是不知道如何使用。
运行https://github.com/ChromiumWebApps/chromium/tree/master/build/android/pylibXXX.py下的一些 文件都报 “ No module named pylib”
求指导。

先收藏,以后有用

collector = surface_stats_collector.SurfaceStatsCollector(adb, activityName,0.5)
楼主什么时候下的 pylib 库,我看这个类实例化时只接受一个参数,你这传了 3

@ice87875494 这个库是用来给其他应用调用的。你应该下载下来后用其他 py 文件 import pylib 来使用。
举个例子:

folder
├─pylib(pylib源码)
│   test.py

此时 test.py 里面使用import pylib就能 import。
在 module xxx 里面 import xxx 是会提示" No module named xxx"的,因为这个 module 不在查找范围内。具体 import 过程可以看看import system

git clone 报 not found?????

每次跑会出这个错,求解

WARNING:root:API STRICT MODE IS DISABLED.
It should be enabled as soon as possible as it will eventually become the default.
Traceback (most recent call last):
File "F:\workspace\fpstest\fpstest.py", line 18, in
collector.Start()
File "F:\workspace\fpstest\pylib\surface_stats_collector.py", line 48, in Start
if self.ClearSurfaceFlingerLatencyData():
File "F:\workspace\fpstest\pylib\surface_stats_collector.py", line 213, in _ClearSurfaceFlingerLatencyData
'dumpsys SurfaceFlinger --latency-clear SurfaceView')
File "F:\workspace\fpstest\pylib\android_commands.py", line 643, in RunShellCommand
"'%s'" % command, timeout_time).splitlines()
File "F:\workspace\fpstest\pylib\adb_interface.py", line 91, in SendShellCommand
retry_count=retry_count)
File "F:\workspace\fpstest\pylib\adb_interface.py", line 72, in SendCommand
retry_count=retry_count)
File "F:\workspace\fpstest\pylib\run_command.py", line 56, in RunCommand
return_output=return_output, stdin_input=stdin_input)
File "F:\workspace\fpstest\pylib\run_command.py", line 104, in RunOnce
preexec_fn=lambda: signal.signal(signal.SIGPIPE, signal.SIG_DFL))
File "C:\Python27\lib\subprocess.py", line 663, in __init
_
raise ValueError("preexec_fn is not supported on Windows "

ValueError: preexec_fn is not supported on Windows platforms

surface_stats_collector.SurfaceStatsCollector(adb, activityName,0.5)
这里为什么需要传 3 个参数呢?源码里不是只需要一个吗?

@sziitash能把所有的代码打包一下给发个链接地址看看吗?

为什么我下载的源码里没有 self._activity
下面这一句里 只有 SurfaceView ,需要自己手动改吗
self._adb.RunShellCommand('dumpsys SurfaceFlinger --latency SurfaceView')

有什么方法可以获取游戏的 FPS 吗?

@sziitash 想请教您 collector = surface_stats_collector.SurfaceStatsCollector(adb, activityName,0.5) 中要传入 SurfaceStatsCollector 的参数为何呢? 例如我想知道 com.android.launcher 的 FPS,那我应该怎么输入呢? 谢谢您

34楼 已删除
benlee #31 · 2016年04月26日 Author

#26 楼 @y35246357468 我帖子的代码是旧的,第三方库的代码已经更新了。使用方式也不一样。
你最好还是自己去看一下最新的代码。
或者你百度 google dumpsys SurfaceFlinger 的相关信息。
更好是参考一下下面的帖子,原理什么的都讲得很清晰了。
https://testerhome.com/topics/2232
https://testerhome.com/topics/4643

如果你想知道 com.android.launcher 的 FPS,你应该先知道 com.android.launcher 的主界面对应的 activity。你可以用 aapt 等工具去查看,具体自己百度和 google 好了。

fenfenzhong [该话题已被删除] 中提及了此贴 07月29日 16:21
fenfenzhong Android 的 UI 呈现 (一) 中提及了此贴 04月12日 10:04
易寒 回复

楼主,有个疑惑,本地试了下,确实是需要 FPS = (indexA-indexB-1)/(timeA-timeB),需要 indexA-indexB-1.这个 timeA 和 timeB 是 umsys SurfaceFlinger + Activity 出来的最后一行第二列的 timestamp 吗?

wxpokay 回复

你的这个问题解决没有? 我也遇到这样的问题 求解

仅楼主可见
williamfzc 利用图像识别与 OCR 进行速度类测试 中提及了此贴 11月12日 11:37
仅楼主可见

你好,我使用 adb shell dumpsys SurfaceFlinger --latency com.ss.android.ugc.aweme/.splash.SplashActivity 只得到一行数据,是咋回事呢

需要 登录 后方可回复, 如果你还没有账号请点击这里 注册