背景
事情的背景是最近在新项目中做 UI 自动化, 就想调研一下如何与浏览器的 API 交互获取一些额外的信息以在 case 失败的时候获取一些额外的信息帮助 debug。 后来就又慢慢延伸到了前端性能测试,弱网测试等场景上去了。 所以把调研的结果记录在这里。 主要是为了解决以下的问题:
- 测试的时候总会遇到一些偶发的 bug,发现自动化 case 失败以后再去页面上操作也很难复现。 所以如果能拿到失败的时候页面里所有请求的 request 和 response 有利于排查问题。 相当于调用了 chrome devtools 的 network 功能。
- 测试的时候总能遇到页面元素加载的比较慢导致 case 失败的。 所以如果能获取页面上每一个资源, 包括 js, 图片, css 等文件以及网络请求的时间数据, 也是能帮助排查问题的。
- 在 UI 自动化测试中引入前端性能测试的需求, 计算页面的一些关键指标, 比如 TTFB。
获取性能信息
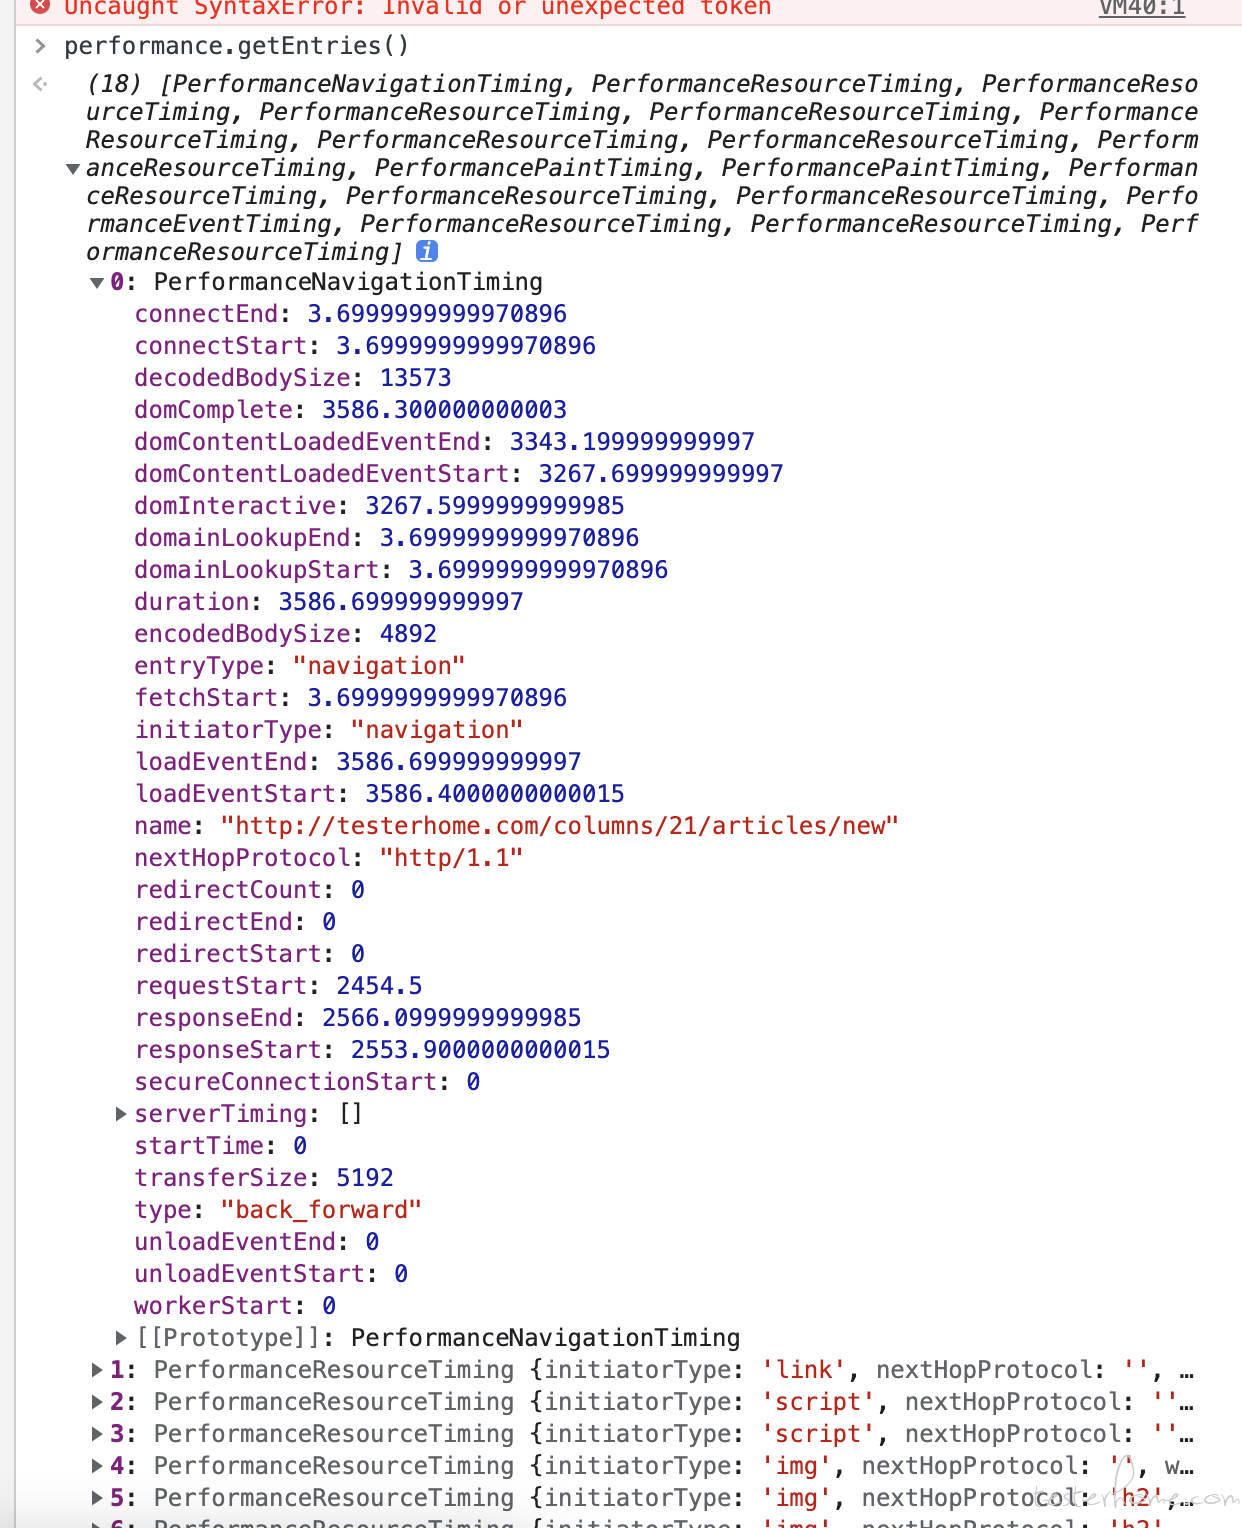
获取性能信息的方法依赖于浏览器的 API, 不过好在目前这个 API 已经形成标准了。 我们打开浏览器的控制台, 就可以自己去编写 js 代码来调用这个 API。 api 有两个, 分别是 performance.timing 和 performance.getEntriesByType. 我们先说第一个接口, 当我们在控制台输入 js 代码后, 就会出现如下的信息:

performance.timing 接口是获取当前页面的各项性能数据。 这其中每个字段的含义如下:
navigationStart:浏览器处理当前网页的启动时间

fetchStart:浏览器发起http请求读取文档的毫秒时间戳。

domainLookupStart:域名查询开始时的时间戳。

domainLookupEnd:域名查询结束时的时间戳。

connectStart:http请求开始向服务器发送的时间戳。

connectEnd:浏览器与服务器连接建立(握手和认证过程结束)的毫秒时间戳。

requestStart:浏览器向服务器发出http请求时的时间戳。或者开始读取本地缓存时。

responseStart:浏览器从服务器(或读取本地缓存)收到第一个字节时的时间戳。

responseEnd:浏览器从服务器收到最后一个字节时的毫秒时间戳。

domLoading:浏览器开始解析网页DOM结构的时间。

domInteractive:网页dom树创建完成,开始加载内嵌资源的时间。

domContentLoadedEventStart:网页DOMContentLoaded事件发生时的时间戳。

domContentLoadedEventEnd:网页所有需要执行的脚本执行完成时的时间,domReady的时间。

domComplete:网页dom结构生成时的时间戳。

loadEventStart:当前网页load事件的回调函数开始执行的时间戳。

loadEventEnd:当前网页load事件的回调函数结束运行时的时间戳。
根据上面给出的信息,我们就可以计算出当前页面相关的性能指标。 比如想计算 TTFB(浏览器处理当前网页的启动时间到接收到服务器的第一个 byte 的时间)的话就是 responseStart - navigationStart 。 先发一下目前我统计的指标:
navigation_start = browser.driver.execute_script("return window.performance.timing.navigationStart")
response_start = browser.driver.execute_script("return window.performance.timing.responseStart")
dom_complete = browser.driver.execute_script("return window.performance.timing.loadEventEnd")

# 开始计算页面性能
backend_performance_calc = response_start - navigation_start  # TTFB(前端从服务端收到第一个字节的时间,也有人称白屏时间)
frontend_performance_calc = dom_complete - response_start  # 前端加载页面时间
dns_duration = browser.driver.execute_script(
    "return (window.performance.timing.domainLookupEnd - window.performance.timing.domainLookupStart)")  # DNS查询时间
tcp_duration = browser.driver.execute_script(
    "return (window.performance.timing.connectEnd - window.performance.timing.connectStart)")  # TCP连接时间

logger.info('当前页面: {url}'.format(url=browser.driver.current_url))
logger.info("TTFB(前端从服务端收到第一个字节的时间): %s 毫秒" % backend_performance_calc)
logger.info("前端加载时间(从服务到收到第一个字节到domComplete的时间): %s 毫秒" % frontend_performance_calc)
logger.info("DNS查询时间: %s 毫秒" % dns_duration)
logger.info("tcp连接时间: %s 毫秒" % tcp_duration)
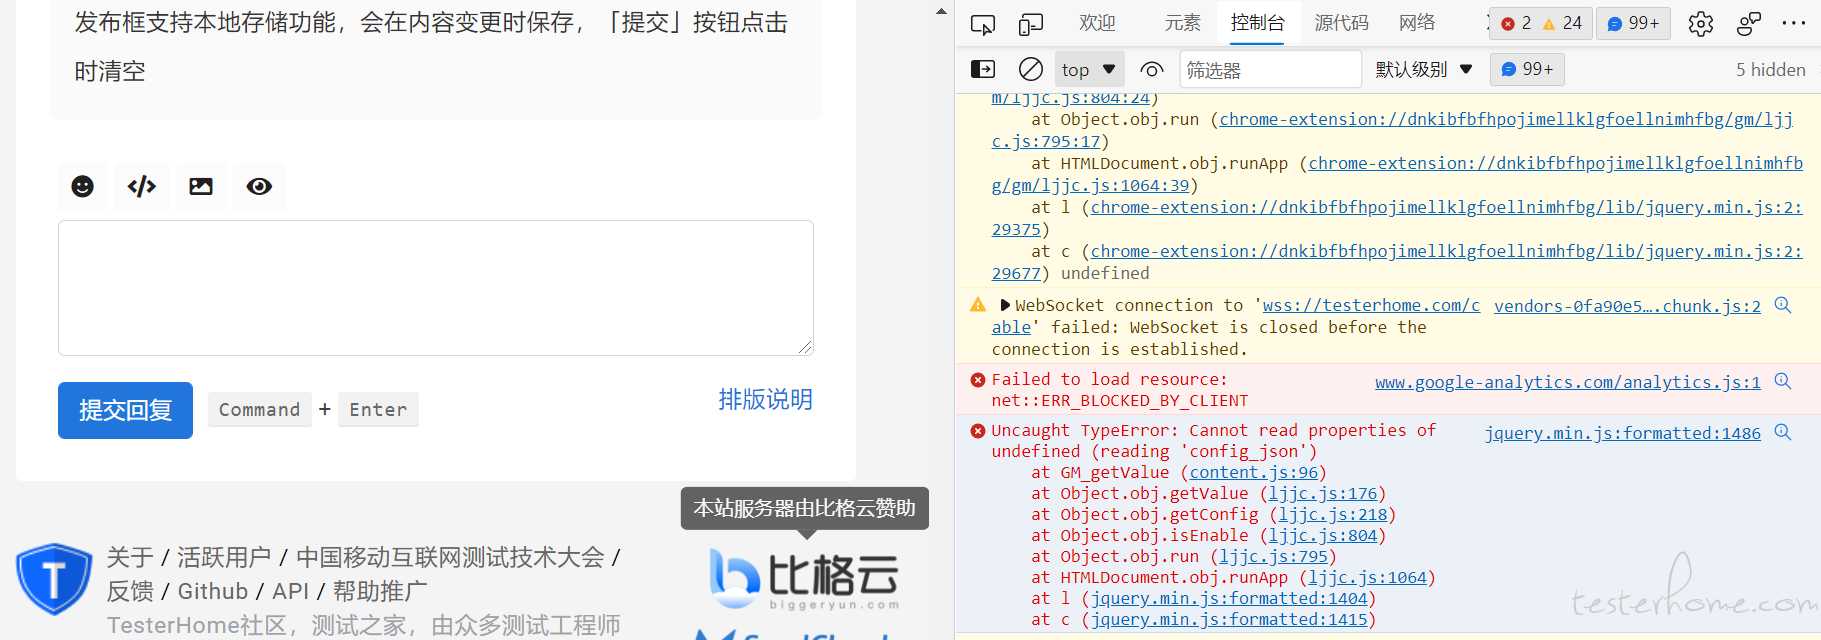
当然这种计算方法是有缺陷的。 因为现在的前端项目都是 event loop, 资源都是异步加载的。 而浏览器现在也都会为同一个域名开 6 个 TCP 链接并发处理。 所以上面的计算 TTFB 的方式只是页面开始渲染的时间。 但是针对没一个 JS, CSS, 图片和网络请求来说我们仍然需要单独计算他们的性能。 所以这里需要用到第二个 APIperformance.getEntriesByType 或者 performance.getEntries。 如下图:
这个 API 会抓取到浏览器与服务交互的每一个请求的性能信息。 所以代码编写如下:
responses = browser.driver.execute_script("return performance.getEntriesByType('resource')")
for r in responses:
    logger.info(
        "资源名称:{name}, 耗时:{duration}毫秒, 传输大小字节数:{transferSize}, encodedBodySize:{encodedBodySize}".format(
            name=r['name'], duration=str(r['duration']),
            transferSize=str(r['transferSize']),
            encodedBodySize=str(r['encodedBodySize'])))
我暂时获取了 duration(这个请求的耗时), encodedBodySize(请求体压缩后的大小,PS:我遇见的都是 GZIP 压缩), transferSize(传输压缩, HTTP1.1 的分块传输要用的), 也可以通过 responseStart - connectionStart 来计算当前请求的 TTFB
抓取请求信息
上面都是抓取的性能信息, 如果我想要知道某个请求的 reqeust 和 response 的信息的话需要借助两样东西, 一个是通过 webdriver 获取 performance log 从中取出基本信息, 然后在 performance log 中获取 request id 去 chrome 浏览器的 devtools 获取对应的 response。
我们先获取 performance log。 首先需要在初始化 chrome 的时候开启 performance log:
option = selenium.webdriver.ChromeOptions()
caps = option.to_capabilities()
caps['goog:loggingPrefs'] = {'performance': 'ALL'}
然后在需要 获取日志的时候调用:
 request_info = {}
browser_log = browser.driver.get_log('performance')
events = [json.loads(entry['message'])['message'] for entry in browser_log]
events = [event for event in events if 'Network.responseReceived' in event['method']]
上面我们通过调用 performance log 来获取当前页面的请求相关的信息。 后面我们过滤了一下只获取 Network.responseReceived 类型的日志。 这是为什么呢? 我们可以理解浏览器的日志是按照事件来记录的。 而我们最常用的事件就是 Network.responseReceived 和 Network.requestWillBeSent. 我们分别看看这两个类型的事件都记录了什么东西:
首先是 Network.requestWillBeSent.
{
"message": {
"method": "Network.requestWillBeSent",
"params": {
"documentURL": "about:blank",
"frameId": "C80F96297F4216E35079CFD86251AB8B",
"initiator": {
"lineNumber": 0,
"type": "parser",
"url": "https://www.suning.com/"
},
"loaderId": "58DDB2CF16600EAE484A541DF9440089",
"redirectResponse": {
"connectionId": 639,
"connectionReused": false,
"encodedDataLength": 497,
"fromDiskCache": false,
"fromServiceWorker": false,
"headers": {
"Cache-Control": "no-cache",
"Connection": "keep-alive",
"Content-Length": "0",
"Date": "Mon, 30 Apr 2018 07:06:42 GMT",
"Expires": "Thu, 01 Jan 1970 00:00:00 GMT",
"Location": "https://cm.g.doubleclick.net/pixel?google_nid=ipy&google_cm",
"P3P": "CP=\"NON DSP COR CURa ADMa DEVa TAIa PSAa PSDa IVAa IVDa CONa HISa TELa OTPa OUR UNRa IND UNI COM NAV INT DEM CNT PRE LOC\"",
"Pragma": "no-cache",
"Server": "nginx/1.10.2",
"Set-Cookie": "CMBMP=IWl; Domain=.ipinyou.com; Expires=Thu, 10-May-2018 07:06:42 GMT; Path=/" },
"headersText": "HTTP/1.1 302 Found\r\nServer: nginx/1.10.2\r\nDate: Mon, 30 Apr 2018 07:06:42 GMT\r\nContent-Length: 0\r\nConnection: keep-alive\r\nCache-Control: no-cache\r\nPragma: no-cache\r\nExpires: Thu, 01 Jan 1970 00:00:00 GMT\r\nP3P: CP=\"NON DSP COR CURa ADMa DEVa TAIa PSAa PSDa IVAa IVDa CONa HISa TELa OTPa OUR UNRa IND UNI COM NAV INT DEM CNT PRE LOC\"\r\nSet-Cookie: CMBMP=IWl; Domain=.ipinyou.com; Expires=Thu, 10-May-2018 07:06:42 GMT; Path=/\r\nLocation: https://cm.g.doubleclick.net/pixel?google_nid=ipy&google_cm\r\n\r\n",
"mimeType": "",
"protocol": "http/1.1",
"remoteIPAddress": "127.0.0.1",
"remotePort": 1086,
"requestHeaders": {
"Accept": "image/webp,image/apng,image/*,*/*;q=0.8",
"Accept-Encoding": "gzip, deflate, br",
"Accept-Language": "zh-CN,zh;q=0.9",
"Connection": "keep-alive",
"Cookie": "sessionId=I4UF6b1WcgGMC; PYID=I4UF6b1Wcg99; CMTMS=p7Ik3Ve; CMSTMS=p7Ik3Ve; CMPUB=ADV-DefaultAdv; CMBMP=IW2",
"Host": "cm.ipinyou.com",
"User-Agent": "Mozilla/5.0 (Macintosh; Intel Mac OS X 10_13_3) AppleWebKit/537.36 (KHTML, like Gecko) Chrome/65.0.3325.181 Safari/537.36" },
"requestHeadersText": "GET /baidu/cms.gif?baidu_error=1×tamp=1525072001 HTTP/1.1\r\nHost: cm.ipinyou.com\r\nConnection: keep-alive\r\nUser-Agent: Mozilla/5.0 (Macintosh; Intel Mac OS X 10_13_3) AppleWebKit/537.36 (KHTML, like Gecko) Chrome/65.0.3325.181 Safari/537.36\r\nAccept: image/webp,image/apng,image/*,*/*;q=0.8\r\nAccept-Encoding: gzip, deflate, br\r\nAccept-Language: zh-CN,zh;q=0.9\r\nCookie: sessionId=I4UF6b1WcgGMC; PYID=I4UF6b1Wcg99; CMTMS=p7Ik3Ve; CMSTMS=p7Ik3Ve; CMPUB=ADV-DefaultAdv; CMBMP=IW2\r\n",
"securityDetails": {
"certificateId": 0,
"cipher": "AES_256_GCM",
"issuer": "RapidSSL SHA256 CA",
"keyExchange": "ECDHE_RSA",
"keyExchangeGroup": "P-256",
"protocol": "TLS 1.2",
"sanList": ["*.ipinyou.com", "ipinyou.com"],
"signedCertificateTimestampList": [{ "hashAlgorithm": "SHA-256", "logDescription": "Symantec log", "logId": "DDEB1D2B7A0D4FA6208B81AD8168707E2E8E9D01D55C888D3D11C4CDB6ECBECC", "origin": "Embedded in certificate", "signatureAlgorithm": "ECDSA", "signatureData": "3045022024364934CBC90A8529E327E6EF853E3EF5E48B7F1598414E0F10059DC92685FC022100A74F93A8CF23D6572D7597C072368D69EC43AFB6A9EDAA4B01B43921AADEFDC2", "status": "Verified", "timestamp": 1511173770857.0 }, { "hashAlgorithm": "SHA-256", "logDescription": "Google 'Pilot' log", "logId": "A4B90990B418581487BB13A2CC67700A3C359804F91BDFB8E377CD0EC80DDC10", "origin": "Embedded in certificate", "signatureAlgorithm": "ECDSA", "signatureData": "3046022100F319D0F56F27C82228E2B01934A1C7F46915A1509F094EE91508F08C3B5AE2B2022100B0D94DD6FD00CB435EC33B916B52EC76FE5FFCC5D5BD8CB559248243AEDFE3CE", "status": "Verified", "timestamp": 1511173770923.0 }],
"subjectName": "*.ipinyou.com",
"validFrom": 1511136000,
"validTo": 1547942399 },
"securityState": "secure",
"status": 302,
"statusText": "Found",
"timing": {
"connectEnd": 772.852999994939,
"connectStart": 0.566999995498918,
"dnsEnd": -1,
"dnsStart": -1,
"proxyEnd": -1,
"proxyStart": -1,
"pushEnd": 0,
"pushStart": 0,
"receiveHeadersEnd": 1226.29800000141,
"requestTime": 42129.997749,
"sendEnd": 773.012999998173,
"sendStart": 772.960999995121,
"sslEnd": 772.844999999506,
"sslStart": 1.62599999748636,
"workerReady": -1,
"workerStart": -1 },
"url": "https://cm.ipinyou.com/baidu/cms.gif?baidu_error=1×tamp=1525072001"
},
"request": {
"headers": {
"User-Agent": "Mozilla/5.0 (Macintosh; Intel Mac OS X 10_13_3) AppleWebKit/537.36 (KHTML, like Gecko) Chrome/65.0.3325.181 Safari/537.36" },
"initialPriority": "Low",
"method": "GET",
"mixedContentType": "none",
"referrerPolicy": "no-referrer-when-downgrade",
"url": "https://cm.g.doubleclick.net/pixel?google_nid=ipy&google_cm"
},
"requestId": "20524.247",
"timestamp": 42131.225431,
"type": "Image",
"wallTime": 1525072000.35906
}
},
"webview": "28DAFE9FE90E9292F1B8EDB3315608EC"
}
然后再看看 Network.responseReceived
{
    "message": {
        "method": "Network.responseReceived",
        "params": {
            "frameId": "28DAFE9FE90E9292F1B8EDB3315608EC",
            "loaderId": "44DBCD0BEBFCEE5AED6388366BCB719B",
            "requestId": "20524.277",
            "response": {
                "connectionId": 468,
                "connectionReused": true,
                "encodedDataLength": 439,
                "fromDiskCache": false,
                "fromServiceWorker": false,
                "headers": {
                    "Cache-Control": "no-cache, max-age=0, must-revalidate",
                    "Connection": "keep-alive",
                    "Content-Length": "43",
                    "Content-Type": "image/gif",
                    "Date": "Mon, 30 Apr 2018 07:06:42 GMT",
                    "Expires": "Fri, 01 Jan 1980 00:00:00 GMT",
                    "Last-Modified": "Mon, 28 Sep 1970 06:00:00 GMT",
                    "Pragma": "no-cache",
                    "Server": "nginx/1.6.3",
                    "X-Dscp-Value": "0",
                    "X-Via": "1.1 dxun38:1 (Cdn Cache Server V2.0), 1.1 shb115:4 (Cdn Cache Server V2.0), 1.1 ls10:0 (Cdn Cache Server V2.0)" },
                "headersText": "HTTP/1.1 200 OK\r\nDate: Mon, 30 Apr 2018 07:06:42 GMT\r\nServer: nginx/1.6.3\r\nContent-Type: image/gif\r\nContent-Length: 43\r\nLast-Modified: Mon, 28 Sep 1970 06:00:00 GMT\r\nExpires: Fri, 01 Jan 1980 00:00:00 GMT\r\nPragma: no-cache\r\nCache-Control: no-cache, max-age=0, must-revalidate\r\nX-Dscp-Value: 0\r\nX-Via: 1.1 dxun38:1 (Cdn Cache Server V2.0), 1.1 shb115:4 (Cdn Cache Server V2.0), 1.1 ls10:0 (Cdn Cache Server V2.0)\r\nConnection: keep-alive\r\n\r\n",
                "mimeType": "image/gif",
                "protocol": "http/1.1",
                "remoteIPAddress": "127.0.0.1",
                "remotePort": 1086,
                "requestHeaders": {
                    "Accept": "image/webp,image/apng,image/*,*/*;q=0.8",
                    "Accept-Encoding": "gzip, deflate, br",
                    "Accept-Language": "zh-CN,zh;q=0.9",
                    "Connection": "keep-alive",
                    "Cookie": "_snstyxuid=ADFD3F4299718846; _snvd=152507199416958111",
                    "Host": "sa.suning.cn",
                    "Referer": "https://www.suning.com/",
                    "User-Agent": "Mozilla/5.0 (Macintosh; Intel Mac OS X 10_13_3) AppleWebKit/537.36 (KHTML, like Gecko) Chrome/65.0.3325.181 Safari/537.36" },
                "requestHeadersText": "GET /ajaxSiteExpro.gif?oId=152507199969277498&pvId=152507199147454663&expoInfo=index3_homepage1_32618013033_word03,index3_homepage1_32618013033_word04,index3_homepage1_newUser_tankuang&expoType=1&pageUrl=https://www.suning.com/&visitorId=&loginUserName=&memberID=-&sessionId=&pageType=web&hidUrlPattern=&iId=log_1525071999692 HTTP/1.1\r\nHost: sa.suning.cn\r\nConnection: keep-alive\r\nUser-Agent: Mozilla/5.0 (Macintosh; Intel Mac OS X 10_13_3) AppleWebKit/537.36 (KHTML, like Gecko) Chrome/65.0.3325.181 Safari/537.36\r\nAccept: image/webp,image/apng,image/*,*/*;q=0.8\r\nReferer: https://www.suning.com/\r\nAccept-Encoding: gzip, deflate, br\r\nAccept-Language: zh-CN,zh;q=0.9\r\nCookie: _snstyxuid=ADFD3F4299718846; _snvd=152507199416958111\r\n",
                "securityDetails": {
                    "certificateId": 0,
                    "cipher": "AES_256_GCM",
                    "issuer": "WoSign OV SSL CA",
                    "keyExchange": "ECDHE_RSA",
                    "keyExchangeGroup": "P-256",
                    "protocol": "TLS 1.2",
                    "sanList": ["*.suning.cn", "suning.cn"],
                    "signedCertificateTimestampList": [],
                    "subjectName": "*.suning.cn",
                    "validFrom": 1479721356,
                    "validTo": 1574329356 },
                "securityState": "secure",
                "status": 200,
                "statusText": "OK",
                "timing": {
                    "connectEnd": -1,
                    "connectStart": -1,
                    "dnsEnd": -1,
                    "dnsStart": -1,
                    "proxyEnd": -1,
                    "proxyStart": -1,
                    "pushEnd": 0,
                    "pushStart": 0,
                    "receiveHeadersEnd": 656.157999997959,
                    "requestTime": 42130.56839,
                    "sendEnd": 1.03800000215415,
                    "sendStart": 0.979999997070991,
                    "sslEnd": -1,
                    "sslStart": -1,
                    "workerReady": -1,
                    "workerStart": -1 },
                "url": "https://sa.suning.cn/ajaxSiteExpro.gif?oId=152507199969277498&pvId=152507199147454663&expoInfo=index3_homepage1_32618013033_word03,index3_homepage1_32618013033_word04,index3_homepage1_newUser_tankuang&expoType=1&pageUrl=https://www.suning.com/&visitorId=&loginUserName=&memberID=-&sessionId=&pageType=web&hidUrlPattern=&iId=log_1525071999692"
            },
            "timestamp": 42131.22618,
            "type": "Image"
        }
    },
    "webview": "28DAFE9FE90E9292F1B8EDB3315608EC"
}
performance log 是浏览器针对网络事件最原始的记录。 我们可以在里面找到很多有用的信息。到目前为主 如果有前端性能相关测试的需求的话都可以用上面介绍的几种方法去扫描。 除了计算 TTFB 和这类的指标外。 还可以获取请求是否经过压缩,过小的数据是否取消了压缩, js,css,图片等类型的资源是否在 header 里加入了 HTTP 的协商缓存, 是否开启了 keep-alived 长连接等等。 当然除了 TTFB, 数据传输大小和时间以外我暂时还没扫描其他的东西, 因为现在这些设置都可以在 nignx 那直接配置。 理论上出现问题的可能性不大。所以我一直在犹豫要不要加上。
上面的方式有个缺陷就是没有办法拿到 response body。 有些时候 UI 自动化失败时由于某个接口调用失败导致的。 所以我是比较希望能再测试报告中记录当前访问的所有请求的入参和返回值的。 这个时候就需要利用 selenium 4 提供的可以调用 chrome 浏览器的 devtools 的能力了。 我们都用过 chrome 的 devtools, 可以在其中 network tab 下看到所有的请求的详情。 所以我们就是要通过调用 API 来获取在浏览器中 network tab 下的信息。 如下:
request_log = browser.driver.get_log('performance')

for i in range(len(request_log)):
    message = json.loads(request_log[i]['message'])
    message = message['message']['params']
    request = message.get('request')
    if request is None:
        continue
    url = request.get('url')
    if url == "http://106.55.161.179/gateway?action=GetVerifyImageAPI":
        print(message['requestId'])
        content = browser.driver.execute_cdp_cmd('Network.getResponseBody', {'requestId': message['requestId']})
execute_cdp_cmd 是向浏览器发送一个命令的方法。 其中 Network.getResponseBody 就是要获取一个请求的 response 的 body. 需要的参数就是 requestid 了。 这个就需要我们在 performance log 中遍历所有的 reqeust 请求, 然后把 reqeustid 拿出来。 这样就能匹配到所有请求的 reqeust 和 response 了。 PS: selenium 调用 devtools 只能在 selenium 4 的本地浏览器上使用。
结尾
差不多就写到这了, 我也是第一次涉及到前端性能相关的东西, 社区有没有大佬来交流一下, 前端性能测试一般都怎么搞。