0.背景
组内需要一款轻量级的性能测试工具,之前考虑过 LR(太笨重,单实例,当然它的地位是不容置疑的),阿里云的 PTS(https://pts.aliyun.com/lite/index.htm, 仅支持阿里云内网和公网机器),Gatling(http://gatling.io/#/) 没有 TPS 数据等等,不太适合我们。
nGrinderr 是 NAVER(韩国最大互联网公司 NHN 旗下搜索引擎网站)开源的性能测试工具,直接部署成 web 服务,支持多用户使用,可扩展性好,可自定义 plugin(http://www.cubrid.org/wiki_ngrinder/entry/how-to-develop-plugin),wiki 文档较丰富 (http://www.cubrid.org/wiki_ngrinder/entry/ngrinder-devzone),数据及图形化展示满足需求;但是展示的统计数据较简单,二次开发整合数据:TPS 标准差,TPS 波动率,最小/大 RT,RT 25/50/75/80/85/90/95/99 百分位数字段,并将这些数据展示在详细测试报告页中。
1.项目剖析
1-1. nGrinder 架构
nGrinder 是一款在一系列机器上执行 Groovy 或 JPython 测试脚本的应用,内部引擎是基于 Grinder。
架构图:

层级图:

默认的 NGRINDER_HOME 为/root/.ngrinder, 大多是配置文件和数据文件。

目录/root/.ngrinder/perftest/0_999 下,以每个 test_id 为名的文件夹对应的存储了执行性能测试时的采样数据:

*.data 文件就是执行性能测试时对应的各种性能采样数据,性能测试详细报告页就是根据这些 data 文件,进行图形化展示(ajax)。
nGrinder 包含 2 大组件:
1)Controller
为性能测试提供 web interface
协同测试进程
收集和显示测试数据
新建和修改脚本
2)Agent
agent mode: 运行进程和线程,压测目标服务
monitor mode: 监控目标系统性能 (cpu/memory), 可以自定义收集的数据 (比如 jvm 数据)
http://www.cubrid.org/wiki_ngrinder/entry/general-architecture
1-2. 技术栈
1) Controller 层
FreeMarker: 基于 Java 的模板引擎
Spring Security
Spring Mvc:Spring MVC provides rich functionality for building robust web applications.
GSon
SVNKit Dav
2) Service 层
Grinder
Spring
EhCache: Ehcache has excellent Spring integration.
3) Data 层
Spring Data
Hibernate:Hibernate is a powerful technology for persisting data,and it is Spring Data back-end within nGrinder.
H2: (nGrinder 默认使用该 DB)
Cubrid:(nGrinder 同一家公司的 DB)
Liquidase: Liquibase is an open source that automates database schema updates.
SVNKit
http://www.cubrid.org/wiki_ngrinder/entry/technology-stack
2.源码实现
需求:在详细测试报告页中展示 TPS 标准差,TPS 波动率,最小/大 RT,RT 25/50/75/80/85/90/95/99 百分位数这些数据。
修改 Controller 层,增加数据处理业务逻辑 (计算 TPS 标准差,TPS 波动率,最小/大 RT,RT 25/50/75/80/85/90/95/99 百分位数)
在获取采样数据
ngrinder-core/src/main/java/net/grinder/SingleConsole.java 中新增处理业务逻辑,核心修改代码片段:
    // tps list
    List<Double> tps = new CopyOnWriteArrayList<Double>();
    // rt list
    List<Double> meanTestTime = new CopyOnWriteArrayList<Double>();

    /**
     *
     * 每次请求调用一次 Build up statistics for current sampling.
     *
     * @param accumulatedStatistics
     *            intervalStatistics
     * @param intervalStatistics
     *            accumulatedStatistics
     */
    protected void updateStatistics(StatisticsSet intervalStatistics,
            StatisticsSet accumulatedStatistics) {
        Map<String, Object> result = newHashMap();
        result.put("testTime", getCurrentRunningTime() / 1000);
        List<Map<String, Object>> cumulativeStatistics = new ArrayList<Map<String, Object>>();
        List<Map<String, Object>> lastSampleStatistics = new ArrayList<Map<String, Object>>();

        for (Test test : accumulatedStatisticMapPerTest.keySet()) {
            Map<String, Object> accumulatedStatisticMap = newHashMap();
            Map<String, Object> intervalStatisticsMap = newHashMap();
            StatisticsSet accumulatedSet = this.accumulatedStatisticMapPerTest
                    .get(test);
            StatisticsSet intervalSet = this.intervalStatisticMapPerTest
                    .get(test);

            accumulatedStatisticMap.put("testNumber", test.getNumber());
            accumulatedStatisticMap.put("testDescription",
                    test.getDescription());
            intervalStatisticsMap.put("testNumber", test.getNumber());
            intervalStatisticsMap.put("testDescription", test.getDescription());
            // When only 1 test is running, it's better to use the parametrized
            // snapshot.
            for (Entry<String, StatisticExpression> each : getExpressionEntrySet()) {
                if (INTERESTING_STATISTICS.contains(each.getKey())) {
                    accumulatedStatisticMap.put(
                            each.getKey(),
                            getRealDoubleValue(each.getValue().getDoubleValue(
                                    accumulatedSet)));
                    intervalStatisticsMap.put(
                            each.getKey(),
                            getRealDoubleValue(each.getValue().getDoubleValue(
                                    intervalSet)));
                }
            }
            cumulativeStatistics.add(accumulatedStatisticMap);
            lastSampleStatistics.add(intervalStatisticsMap);
        }

        Map<String, Object> totalStatistics = newHashMap();

        for (Entry<String, StatisticExpression> each : getExpressionEntrySet()) {
            if (INTERESTING_STATISTICS.contains(each.getKey())) {
                totalStatistics.put(each.getKey(), getRealDoubleValue(each
                        .getValue().getDoubleValue(accumulatedStatistics)));
            }
        }

        LOGGER.debug("hugang start get plug data");

        // 获取tps, rt集合
        for (Entry<String, StatisticExpression> each : getExpressionEntrySet()) {
            if ("TPS".equals(each.getKey())) {
                tps.add((Double) getRealDoubleValue(each.getValue()
                        .getDoubleValue(intervalStatistics)));
            } else if ("Mean_Test_Time_(ms)".equals(each.getKey())) {
                meanTestTime.add((Double) getRealDoubleValue(each.getValue()
                        .getDoubleValue(intervalStatistics)));
            }
        }


        result.put("totalStatistics", totalStatistics);
        result.put("cumulativeStatistics", cumulativeStatistics);
        result.put("lastSampleStatistics", lastSampleStatistics);
        result.put("tpsChartData", getTpsValues());
        result.put("peakTpsForGraph", this.peakTpsForGraph);
        synchronized (this) {
            result.put(GrinderConstants.P_PROCESS, this.runningProcess);
            result.put(GrinderConstants.P_THREAD, this.runningThread);
            result.put("success", !isAllTestFinished());
        }
        // Finally overwrite.. current one.
        this.statisticData = result;
    }

    /**
     * 从updateStatistics()累加数据, list :rt 和 tps, 为成员变量
     *
     * 再处理集合,放到statisticData中
     *
     * @author hugang
     */
    public void getPlusResult(){

        LOGGER.debug("hugang getPlusResult() tpslist {}  rtlist is {}",
                tps.toString(), meanTestTime.toString());

        int i = 0;
        int j = 0;
        // list转成数组, 标准库使用数组作为参数
        double[] tpsArray = new double[tps.size()];
        for (double tpsNum : tps) {
            tpsArray[i++] = tpsNum;
        }

        // list转成数组
        double[] meanTestTimeArray = new double[meanTestTime.size()];
        for (double meanTime : meanTestTime) {
            meanTestTimeArray[j++] = meanTime;
        }

        // tps 标准差
        double tpsStd = new StandardDeviation().evaluate(tpsArray);
        // tps 平均值
        double tpsMean = new Mean().evaluate(tpsArray, 0, tpsArray.length);
        // tps 波动率= tps 标准差 / tps 平均值
        double tpsVix = 0;
        if(0 != tpsMean){
            tpsVix = tpsStd / tpsMean;
        }

        // meanTestTime 百分位数
        Percentile percentile = new Percentile();
        // 先排序
        Arrays.sort(meanTestTimeArray);
        // meanTestTime最小值
        double minMeanTime = meanTestTimeArray[0];
        double twentyFiveMeanTime = percentile.evaluate(meanTestTimeArray, 25);
        double fiftyMeanTime = percentile.evaluate(meanTestTimeArray, 50);
        double serventyFiveMeanTime = percentile
                .evaluate(meanTestTimeArray, 75);
        double eightyMeanTime = percentile.evaluate(meanTestTimeArray, 80);
        double eightyFiveMeanTime = percentile.evaluate(meanTestTimeArray, 85);
        double ninetyMeanTime = percentile.evaluate(meanTestTimeArray, 90);
        double ninetyFiveMeanTime = percentile.evaluate(meanTestTimeArray, 95);
        double ninetyNineMeanTime = percentile.evaluate(meanTestTimeArray, 99);

        int length = meanTestTimeArray.length;
        // meanTestTime最高值
        double maxMeanTime = meanTestTimeArray[length - 1];
        // meanTestTime平均值
        // double TimeMean = new Mean().evaluate(meanTestTimeArray, 0,
        // meanTestTimeArray.length);

        LOGGER.debug(
                "hugang plug Statistics MinMeanTime {}  MaxMeanTime is {}",
                minMeanTime, maxMeanTime);
        // 附加信息 hugang
        // tps 标准差, tps 波动率, 最小/最大RT, RT百分位数
        Map<String, Object> plusStatistics = newHashMap();
        plusStatistics.put("tpsStd", tpsStd);
//      plusStatistics.put("tpsMean", tpsMean);
        plusStatistics.put("tpsVix", tpsVix);
        plusStatistics.put("minMeanTime", minMeanTime);
        plusStatistics.put("twentyFiveMeanTime", twentyFiveMeanTime);
        plusStatistics.put("fiftyMeanTime", fiftyMeanTime);
        plusStatistics.put("serventyFiveMeanTime", serventyFiveMeanTime);
        plusStatistics.put("eightyMeanTime", eightyMeanTime);
        plusStatistics.put("eightyFiveMeanTime", eightyFiveMeanTime);
        plusStatistics.put("ninetyMeanTime", ninetyMeanTime);
        plusStatistics.put("ninetyFiveMeanTime", ninetyFiveMeanTime);
        plusStatistics.put("ninetyNineMeanTime", ninetyNineMeanTime);
        plusStatistics.put("maxMeanTime", maxMeanTime);


        LOGGER.debug("SingleConsole plug Statistics map plusStatistics {}", plusStatistics);


        this.statisticData.put("plusStatistics", plusStatistics);
    }


    /**
     *
     * 停止采样数据
     * Stop sampling.
     */
    public void unregisterSampling() {
        this.currentNotFinishedProcessCount = 0;
        if (sampleModel != null) {
            this.sampleModel.reset();
            this.sampleModel.stop();
        }
        LOGGER.info("Sampling is stopped");
        informTestSamplingEnd();

        // 结束采样后,处理数据
        // hugang
        getPlusResult();
    }
Map statisticData 为不同数据集集合。
Service 层从 SingleConsole 类中获取数据集 statisticData:
ngrinder-controller/src/main/java/org/ngrinder/perftest/server/PerfTestService.java 中Map<String, Object> result = consoleManager.getConsoleUsingPort(perfTest.getPort()).getStatisticsData();
/**
     * Update the given {@link PerfTest} properties after test finished.
     *
     * @param perfTest perfTest
     *
     * getConsoleUsingPort()获取数据
     *
     *
     * hugang
     */
    public void updatePerfTestAfterTestFinish(PerfTest perfTest) {
        checkNotNull(perfTest);
        Map<String, Object> result = consoleManager.getConsoleUsingPort(perfTest.getPort()).getStatisticsData();
        @SuppressWarnings("unchecked")
        Map<String, Object> totalStatistics = MapUtils.getMap(result, "totalStatistics", MapUtils.EMPTY_MAP);
        // 获取附加数据
        Map<String, Object> plusStatistics = MapUtils.getMap(result, "plusStatistics", MapUtils.EMPTY_MAP);

        LOGGER.info("Total Statistics for test {}  is {}", perfTest.getId(), totalStatistics);
        LOGGER.info("plug Statistics for test {}  is {}", perfTest.getId(), plusStatistics);

        perfTest.setTps(parseDoubleWithSafety(totalStatistics, "TPS", 0D));
        perfTest.setMeanTestTime(parseDoubleWithSafety(totalStatistics, "Mean_Test_Time_(ms)", 0D));
        perfTest.setPeakTps(parseDoubleWithSafety(totalStatistics, "Peak_TPS", 0D));
        perfTest.setTests(MapUtils.getDouble(totalStatistics, "Tests", 0D).longValue());
        perfTest.setErrors(MapUtils.getDouble(totalStatistics, "Errors", 0D).longValue());


        // 附加信息写到model, 持久化
        perfTest.setTpsStd(parseDoubleWithSafety(plusStatistics, "tpsStd", 0D));
        perfTest.setTpsVix(parseDoubleWithSafety(plusStatistics, "tpsVix", 0D));
        perfTest.setMinRT(parseDoubleWithSafety(plusStatistics, "minMeanTime", 0D));
        perfTest.setTwentyFiveMeanTime(parseDoubleWithSafety(plusStatistics, "twentyFiveMeanTime", 0D));
        perfTest.setFiftyMeanTime(parseDoubleWithSafety(plusStatistics, "fiftyMeanTime", 0D));
        perfTest.setServentyFiveMeanTime(parseDoubleWithSafety(plusStatistics, "serventyFiveMeanTime", 0D));
        perfTest.setEightyMeanTime(parseDoubleWithSafety(plusStatistics, "eightyMeanTime", 0D));
        perfTest.setEightyFiveMeanTime(parseDoubleWithSafety(plusStatistics, "eightyFiveMeanTime", 0D));
        perfTest.setNinetyMeanTime(parseDoubleWithSafety(plusStatistics, "ninetyMeanTime", 0D));
        perfTest.setNinetyFiveMeanTime(parseDoubleWithSafety(plusStatistics, "ninetyFiveMeanTime", 0D));
        perfTest.setNinetyNineMeanTime(parseDoubleWithSafety(plusStatistics, "ninetyNineMeanTime", 0D));
        perfTest.setMaxRT(parseDoubleWithSafety(plusStatistics, "maxMeanTime", 0D));


    }
修改 Model 层,在 javabean 中增加 TPS 标准差,TPS 波动率,最小/大 RT,RT 25/50/75/80/85/90/95/99 百分位数, JPA 持久化(H2 DB 新增 TPS 标准差,TPS 波动率,最小/大 RT,RT 25/50/75/80/85/90/95/99 百分位数字段)
model 文件为:ngrinder-core/src/main/java/org/ngrinder/model/PerfTest.java
/**
 * 新增字段,TPS标准差,TPS波动率,最小/大RT,RT 25/50/75/80/85/90/95/99百分位数
 * hugang
 */
@Expose
@Column(name = "tpsStd")
private Double tpsStd;

@Expose
@Column(name = "tpsVix")
private Double tpsVix;


@Expose
@Column(name = "minRT")
private Double minRT;

@Expose
@Column(name = "twentyFiveMeanTime")
private Double twentyFiveMeanTime;

@Expose
@Column(name = "fiftyMeanTime")
private Double fiftyMeanTime;

@Expose
@Column(name = "serventyFiveMeanTime")
private Double serventyFiveMeanTime;

@Expose
@Column(name = "eightyMeanTime")
private Double eightyMeanTime;

@Expose
@Column(name = "eightyFiveMeanTime")
private Double eightyFiveMeanTime;

@Expose
@Column(name = "ninetyMeanTime")
private Double ninetyMeanTime;

@Expose
@Column(name = "ninetyFiveMeanTime")
private Double ninetyFiveMeanTime;

@Expose
@Column(name = "ninetyNineMeanTime")
private Double ninetyNineMeanTime;

@Expose
@Column(name = "maxRT")
private Double maxRT;


对应的set(), get()
还需修改 db change 文件 (因为系统 DB 默认使用 H2, 只需修改 H2 对应的 xml),ngrinder-controller/src/main/resources/ngrinder_datachange_logfile/db.changelog_schema_H2.xml
create table PERF_TEST (
            id bigint generated by default as identity unique,
            created_date timestamp,
            last_modified_date timestamp,
            agent_count integer,
            description varchar(2048),
            distribution_path varchar(255),
            duration bigint,
            errors integer,
            finish_time timestamp,
            ignore_sample_count integer,
            init_processes integer,
            init_sleep_time integer,
            last_progress_message varchar(2048),
            mean_test_time double,
            peak_tps double,
            errorRate double,
            tpsStd double,
            tpsVix double,
            minRT double,
            twentyFiveMeanTime double,
            fiftyMeanTime double,
            serventyFiveMeanTime double,
            eightyMeanTime double,
            eightyFiveMeanTime double,
            ninetyMeanTime double,
            ninetyFiveMeanTime double,
            ninetyNineMeanTime double,
            maxRT double,
系统重启加载时,Liquidase 会自动更新 DB。
修改 View 层,在详细报告对应的 freemarker 模板新增 TPS 标准差,TPS 波动率,最小/大 RT,RT 25/50/75/80/85/90/95/99 百分位数字段,前端新增展示这些数据
ngrinder-controller/src/main/webapp/WEB-INF/ftl/perftest/detail_report.ftl
<#-- hugang -->
<#-- 新增 错误率,TPS标准差,TPS波动率,最小RT, 最大RT, RT 25/50/75/80/85/90/95/99百分位数 -->
<tr>
<th><@spring.message "perfTest.report.errorRate"/></th>
<td>${(test.errors /(test.tests + test.errors))!""}</td>
</tr>
<tr>
<th><@spring.message "perfTest.report.tpsStd"/></th>
<td>${test.tpsStd!""}</td>
</tr>
<tr>
<th><@spring.message "perfTest.report.tpsVix"/></th>
<td>${test.tpsVix!""}</td>
</tr>
<tr>
<th><@spring.message "perfTest.report.minRT"/></th>
<td>${test.minRT!""} <code>ms</code></td>
</tr>
<tr>
<th><@spring.message "perfTest.report.TwentyFiveMeanTime"/></th>
<td>${test.twentyFiveMeanTime!""} <code>ms</code></td>
</tr>
<tr>
<th><@spring.message "perfTest.report.FiftyMeanTime"/></th>
<td>${test.fiftyMeanTime!""} <code>ms</code></td>
</tr>
<tr>
<th><@spring.message "perfTest.report.ServentyFiveMeanTime"/></th>
<td>${test.serventyFiveMeanTime!""} <code>ms</code></td>
</tr>
<tr>
<th><@spring.message "perfTest.report.EightyMeanTime"/></th>
<td>${test.eightyMeanTime!""} <code>ms</code></td>
</tr>
</tr>
<tr>
<th><@spring.message "perfTest.report.EightyFiveMeanTime"/></th>
<td>${test.eightyFiveMeanTime!""} <code>ms</code></td>
</tr>
</tr>
<tr>
<th><@spring.message "perfTest.report.NinetyMeanTime"/></th>
<td>${test.ninetyMeanTime!""} <code>ms</code></td>
</tr>
</tr>
<tr>
<th><@spring.message "perfTest.report.NinetyFiveMeanTime"/></th>
<td>${test.ninetyFiveMeanTime!""} <code>ms</code></td>
</tr>
</tr>
<tr>
<th><@spring.message "perfTest.report.NinetyNineMeanTime"/></th>
<td>${test.ninetyNineMeanTime!""} <code>ms</code></td>
</tr>
</tr>
<tr>
<th><@spring.message "perfTest.report.maxRT"/></th>
<td>${test.maxRT!""} <code>ms</code></td>
</tr>
还有个坑,就是从 github 拉下的代码,源码中 pom.xml 依赖的 jar 包不完整,直接打不了包,项目有的依赖的 jar 公有 maven 仓库已经没有了,需要自己从网上找 jar 包,安装到本地仓库,我归整了下:
http://download.csdn.net/detail/neven7/9443895
直接在 ngrinder 根路径下执行打包命令:
mvn -Dmaven.test.skip=true clean package
部署生成的 war 即可。
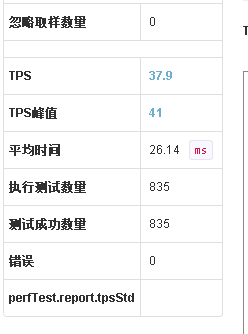
3.结果展示
在详细报告页新增如下数据结果: