Java jmeter 的 PerfMon Metrics Collector 报 JAVA 环境错误
说明:因为远程服务器无法链接所以先在本地进行测试。一共三个文件都放在了本地路径正确且 startAgent.bat 路径无中文名。
步骤一
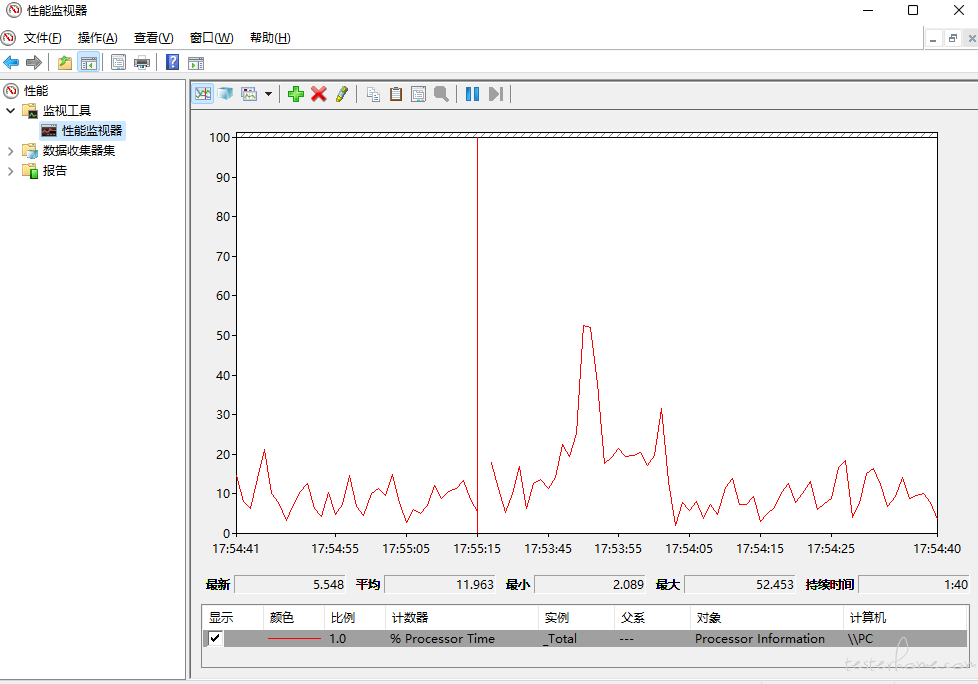
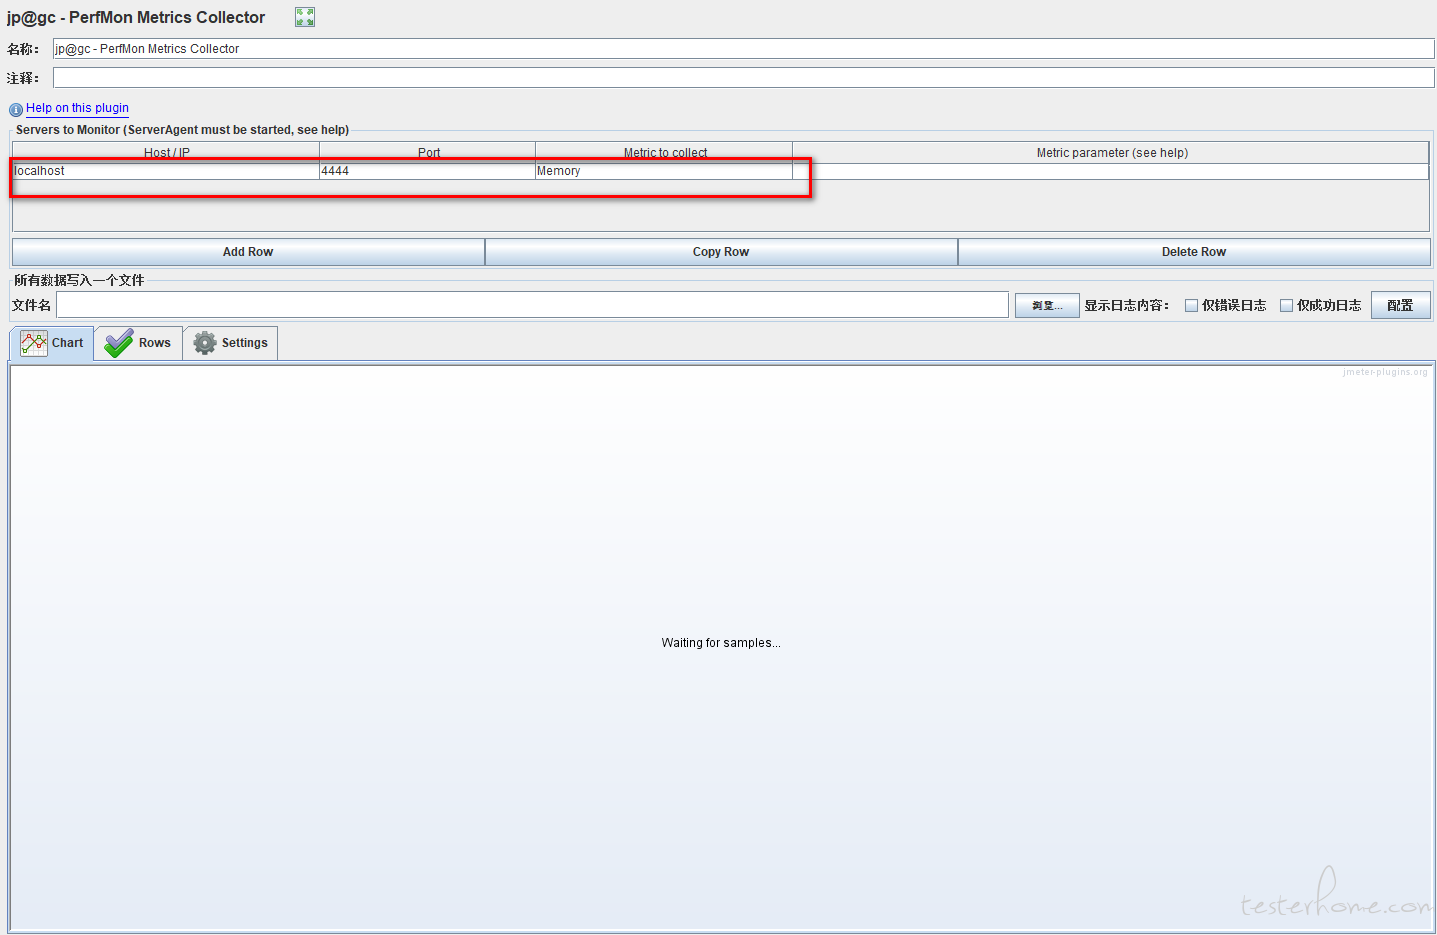
在 jmeter 中添加 PerfMon Metrics Collector 监听器 并配置 ip 为 localhost 端口为 4444 监控 Memory
步骤二
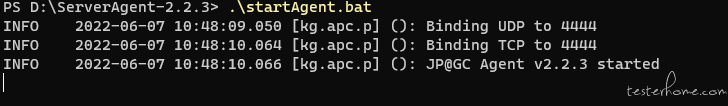
启动本机的 startAgent.bat
步骤三
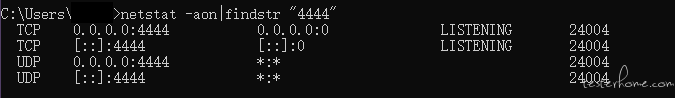
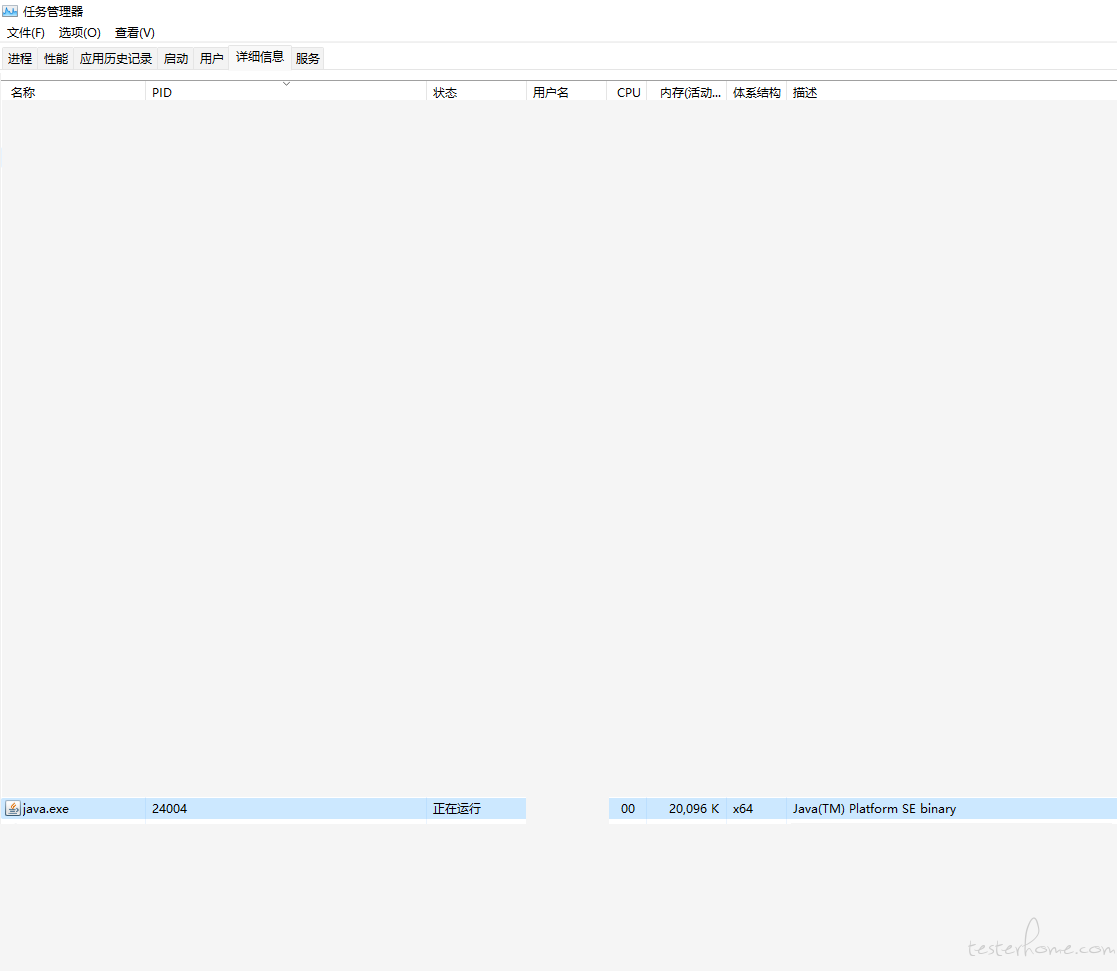
再次验证是否启动及其对应的 PID
# 步骤四
在 jmeter 中完善可能影响 PerfMon Metrics Collector 监视器异常工作的控件
1)添加线程组并将循环次数设置为永久
2)添加一个 HTTP 请求(不用设置任何参数)
3)将步骤一配置好的 PerfMon Metrics Collector 监视器拖进这个线程组。
步骤五
运行该线程组
Error 1:(未完待更新)
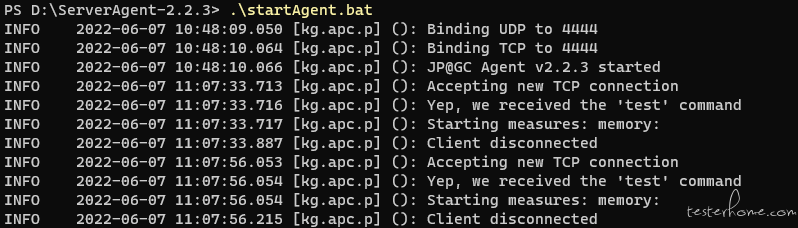
总是显示客户端断开连接
Error2:(重要,这个我不会解决)
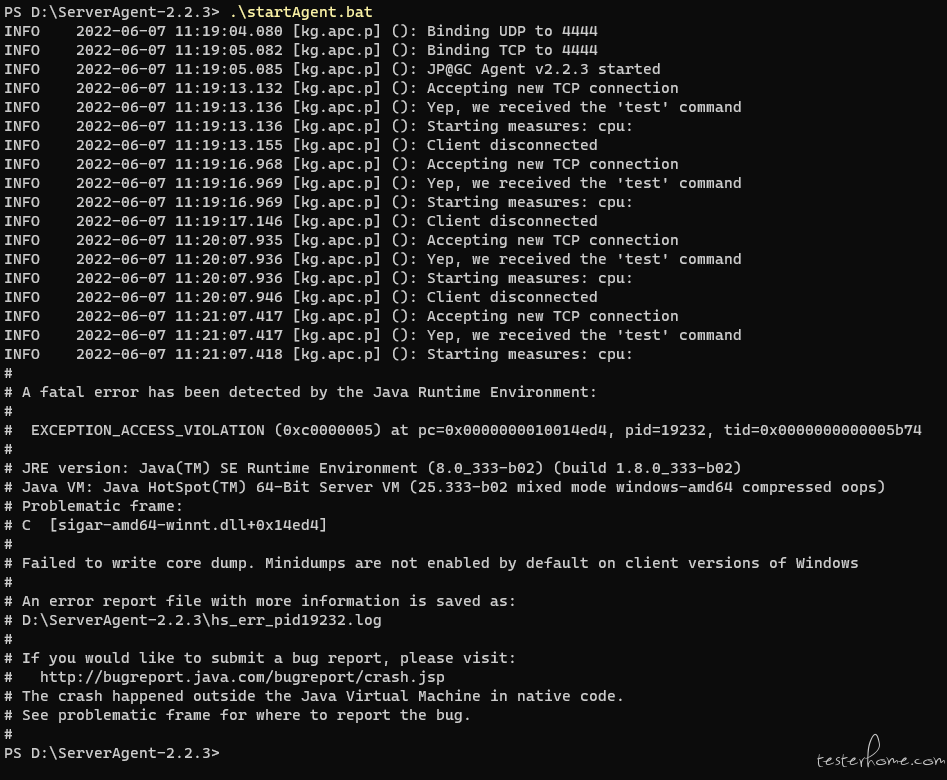
如下:JAVA 代码块中的内容就是图片里的 log 日志内容。
#
# A fatal error has been detected by the Java Runtime Environment:
#
#  EXCEPTION_ACCESS_VIOLATION (0xc0000005) at pc=0x0000000010014ed4, pid=19232, tid=0x0000000000005b74
#
# JRE version: Java(TM) SE Runtime Environment (8.0_333-b02) (build 1.8.0_333-b02)
# Java VM: Java HotSpot(TM) 64-Bit Server VM (25.333-b02 mixed mode windows-amd64 compressed oops)
# Problematic frame:
# C  [sigar-amd64-winnt.dll+0x14ed4]
#
# Failed to write core dump. Minidumps are not enabled by default on client versions of Windows
#
# If you would like to submit a bug report, please visit:
#   http://bugreport.java.com/bugreport/crash.jsp
# The crash happened outside the Java Virtual Machine in native code.
# See problematic frame for where to report the bug.
#

---------------  T H R E A D  ---------------

Current thread (0x00000196fd72a000):  JavaThread "Thread-0" [_thread_in_native, id=23412, stack(0x0000005ff1500000,0x0000005ff1600000)]

siginfo: ExceptionCode=0xc0000005, reading address 0xfffffffff2096c18

Registers:
RAX=0xfffffffff2096ae0, RBX=0x00000196fb02a668, RCX=0x00000196fd72a200, RDX=0x0000005ff15fe7b0
RSP=0x0000005ff15fe5f0, RBP=0x0000005ff15fe790, RSI=0x0000000000200021, RDI=0x00000196fb012748
R8 =0x0000000000000032, R9 =0x0000000780702b40, R10=0x000000000000001c, R11=0x000000005b11aa9c
R12=0x0000000000000000, R13=0x00000196fb02a660, R14=0x0000005ff15fe7b8, R15=0x00000196fd72a000
RIP=0x0000000010014ed4, EFLAGS=0x0000000000010282

Top of Stack: (sp=0x0000005ff15fe5f0)
0x0000005ff15fe5f0:   00000196fd72a200 0000005ff15fe7b0
0x0000005ff15fe600:   00000196fd72a000 0000000000000000
0x0000005ff15fe610:   fffffffff2096ae0 0000000000000000
0x0000005ff15fe620:   0000005ff15fe7b8 0000000010018291
0x0000005ff15fe630:   00000196fd72a200 0000005ff15fe7b0
0x0000005ff15fe640:   0000000000200021 00000196fb012748
0x0000005ff15fe650:   00000196fd72a000 0000000000000000
0x0000005ff15fe660:   00000196fb02a668 0000000000000000
0x0000005ff15fe670:   00000196fd72a000 0000005ff15fe7b8
0x0000005ff15fe680:   0000005ff15fe790 000000005aa0357b
0x0000005ff15fe690:   0000005ff15fe6c0 0000000000000000
0x0000005ff15fe6a0:   00000196fb02a668 00000196fd6a7498
0x0000005ff15fe6b0:   00000196fb02a668 00000196fd72a000
0x0000005ff15fe6c0:   00000196fb02a668 00000196fd72a000
0x0000005ff15fe6d0:   00000196fb012748 0000000000200021
0x0000005ff15fe6e0:   00000196fb02a668 0000019680019e86

Instructions: (pc=0x0000000010014ed4)
0x0000000010014eb4:   7c 24 20 00 75 15 48 8d 15 df 58 04 00 48 8b 4c
0x0000000010014ec4:   24 40 e8 45 00 00 00 33 c0 eb 32 48 8b 44 24 20
0x0000000010014ed4:   83 b8 38 01 00 00 00 74 1f 48 8b 44 24 20 44 8b
0x0000000010014ee4:   80 38 01 00 00 48 8b 54 24 20 48 8b 4c 24 40 e8


Register to memory mapping:

RAX=0xfffffffff2096ae0 is an unknown value
RBX={method} {0x00000196fb02a670} 'gather' '(Lorg/hyperic/sigar/Sigar;)V' in 'org/hyperic/sigar/Cpu'
RCX=0x00000196fd72a200 is an unknown value
RDX=0x0000005ff15fe7b0 is pointing into the stack for thread: 0x00000196fd72a000
RSP=0x0000005ff15fe5f0 is pointing into the stack for thread: 0x00000196fd72a000
RBP=0x0000005ff15fe790 is pointing into the stack for thread: 0x00000196fd72a000
RSI=0x0000000000200021 is an unknown value
RDI={method} {0x00000196fb012750} 'getCpuPerc' '()Lorg/hyperic/sigar/CpuPerc;' in 'org/hyperic/sigar/Sigar'
R8 =0x0000000000000032 is an unknown value
R9 =0x0000000780702b40 is an oop
org.hyperic.sigar.Sigar
 - klass: 'org/hyperic/sigar/Sigar'
R10=0x000000000000001c is an unknown value
R11=0x000000005b11aa9c is an unknown value
R12=0x0000000000000000 is an unknown value
R13=0x00000196fb02a660 is pointing into metadata
R14=0x0000005ff15fe7b8 is pointing into the stack for thread: 0x00000196fd72a000
R15=0x00000196fd72a000 is a thread


Stack: [0x0000005ff1500000,0x0000005ff1600000],  sp=0x0000005ff15fe5f0,  free space=1017k
Native frames: (J=compiled Java code, j=interpreted, Vv=VM code, C=native code)
C  [sigar-amd64-winnt.dll+0x14ed4]
C  [sigar-amd64-winnt.dll+0x18291]
C  0x000001968001a02e

Java frames: (J=compiled Java code, j=interpreted, Vv=VM code)
j  org.hyperic.sigar.Cpu.gather(Lorg/hyperic/sigar/Sigar;)V+0
j  org.hyperic.sigar.Cpu.fetch(Lorg/hyperic/sigar/Sigar;)Lorg/hyperic/sigar/Cpu;+10
j  org.hyperic.sigar.Sigar.getCpu()Lorg/hyperic/sigar/Cpu;+1
j  org.hyperic.sigar.Sigar.getCpuPerc()Lorg/hyperic/sigar/CpuPerc;+8
v  ~StubRoutines::call_stub
j  sun.reflect.NativeMethodAccessorImpl.invoke0(Ljava/lang/reflect/Method;Ljava/lang/Object;[Ljava/lang/Object;)Ljava/lang/Object;+0
j  sun.reflect.NativeMethodAccessorImpl.invoke(Ljava/lang/Object;[Ljava/lang/Object;)Ljava/lang/Object;+100
j  sun.reflect.DelegatingMethodAccessorImpl.invoke(Ljava/lang/Object;[Ljava/lang/Object;)Ljava/lang/Object;+6
j  java.lang.reflect.Method.invoke(Ljava/lang/Object;[Ljava/lang/Object;)Ljava/lang/Object;+56
j  org.hyperic.sigar.SigarProxyCache.invoke(Ljava/lang/Object;Ljava/lang/reflect/Method;[Ljava/lang/Object;)Ljava/lang/Object;+363
j  com.sun.proxy.$Proxy0.getCpuPerc()Lorg/hyperic/sigar/CpuPerc;+9
j  kg.apc.perfmon.metrics.CPUTotalMetric.getValue(Ljava/lang/StringBuffer;)V+11
j  kg.apc.perfmon.PerfMonMetricGetter.getMetricsLine()Ljava/nio/ByteBuffer;+51
j  kg.apc.perfmon.PerfMonWorker.processSenders()V+106
j  kg.apc.perfmon.PerfMonWorker.run()V+8
j  java.lang.Thread.run()V+11
v  ~StubRoutines::call_stub

---------------  P R O C E S S  ---------------

Java Threads: ( => current thread )
=>0x00000196fd72a000 JavaThread "Thread-0" [_thread_in_native, id=23412, stack(0x0000005ff1500000,0x0000005ff1600000)]
  0x00000196fc17e800 JavaThread "Service Thread" daemon [_thread_blocked, id=21452, stack(0x0000005ff1300000,0x0000005ff1400000)]
  0x00000196fc16d000 JavaThread "C1 CompilerThread3" daemon [_thread_blocked, id=27080, stack(0x0000005ff1200000,0x0000005ff1300000)]
  0x00000196fc162000 JavaThread "C2 CompilerThread2" daemon [_thread_blocked, id=24752, stack(0x0000005ff1100000,0x0000005ff1200000)]
  0x00000196fc161800 JavaThread "C2 CompilerThread1" daemon [_thread_blocked, id=7132, stack(0x0000005ff1000000,0x0000005ff1100000)]
  0x00000196fc10b000 JavaThread "C2 CompilerThread0" daemon [_thread_blocked, id=28108, stack(0x0000005ff0f00000,0x0000005ff1000000)]
  0x00000196fc10a800 JavaThread "Attach Listener" daemon [_thread_blocked, id=3220, stack(0x0000005ff0e00000,0x0000005ff0f00000)]
  0x00000196fc15d000 JavaThread "Signal Dispatcher" daemon [_thread_blocked, id=2196, stack(0x0000005ff0d00000,0x0000005ff0e00000)]
  0x00000196fc0d7800 JavaThread "Finalizer" daemon [_thread_blocked, id=15732, stack(0x0000005ff0c00000,0x0000005ff0d00000)]
  0x00000196fc0a8800 JavaThread "Reference Handler" daemon [_thread_blocked, id=5740, stack(0x0000005ff0b00000,0x0000005ff0c00000)]
  0x00000196f1cf6000 JavaThread "main" [_thread_in_native, id=20940, stack(0x0000005ff0100000,0x0000005ff0200000)]

Other Threads:
  0x00000196fc0a1800 VMThread [stack: 0x0000005ff0a00000,0x0000005ff0b00000] [id=11064]
  0x00000196fd444000 WatcherThread [stack: 0x0000005ff1400000,0x0000005ff1500000] [id=27700]

VM state:not at safepoint (normal execution)

VM Mutex/Monitor currently owned by a thread: None

heap address: 0x0000000700800000, size: 3064 MB, Compressed Oops mode: Zero based, Oop shift amount: 3
Narrow klass base: 0x0000000000000000, Narrow klass shift: 3
Compressed class space size: 1073741824 Address: 0x00000007c0000000

Heap:
 PSYoungGen      total 57344K, used 7872K [0x0000000780300000, 0x0000000784300000, 0x00000007c0000000)
  eden space 49152K, 16% used [0x0000000780300000,0x0000000780ab0210,0x0000000783300000)
  from space 8192K, 0% used [0x0000000783b00000,0x0000000783b00000,0x0000000784300000)
  to   space 8192K, 0% used [0x0000000783300000,0x0000000783300000,0x0000000783b00000)
 ParOldGen       total 131072K, used 0K [0x0000000700800000, 0x0000000708800000, 0x0000000780300000)
  object space 131072K, 0% used [0x0000000700800000,0x0000000700800000,0x0000000708800000)
 Metaspace       used 5863K, capacity 6048K, committed 6144K, reserved 1056768K
  class space    used 666K, capacity 696K, committed 768K, reserved 1048576K

Card table byte_map: [0x00000196f3c20000,0x00000196f4220000] byte_map_base: 0x00000196f041c000

Marking Bits: (ParMarkBitMap*) 0x000000005b129030
 Begin Bits: [0x00000196f4620000, 0x00000196f7600000)
 End Bits:   [0x00000196f7600000, 0x00000196fa5e0000)

Polling page: 0x00000196f1f70000

CodeCache: size=245760Kb used=1865Kb max_used=1865Kb free=243894Kb
 bounds [0x0000019680000000, 0x0000019680270000, 0x000001968f000000]
 total_blobs=651 nmethods=343 adapters=221
 compilation: enabled

Compilation events (10 events):
Event: 115.708 Thread 0x00000196fc16d000  339   !   3       sun.nio.ch.SelectorImpl::processDeregisterQueue (101 bytes)
Event: 115.709 Thread 0x00000196fc16d000 nmethod 339 0x00000196801d17d0 code [0x00000196801d19e0, 0x00000196801d2580]
Event: 116.718 Thread 0x00000196fc16d000  340       1       sun.nio.ch.WindowsSelectorImpl::access$1200 (5 bytes)
Event: 116.718 Thread 0x00000196fc16d000 nmethod 340 0x00000196801d2b10 code [0x00000196801d2c60, 0x00000196801d2d58]
Event: 116.718 Thread 0x00000196fc16d000  341       1       sun.nio.ch.WindowsSelectorImpl::access$1400 (5 bytes)
Event: 116.718 Thread 0x00000196fc16d000 nmethod 341 0x00000196801d2dd0 code [0x00000196801d2f20, 0x00000196801d3018]
Event: 116.718 Thread 0x00000196fc16d000  342       1       sun.nio.ch.WindowsSelectorImpl::access$1500 (5 bytes)
Event: 116.718 Thread 0x00000196fc16d000 nmethod 342 0x00000196801d3090 code [0x00000196801d31e0, 0x00000196801d32d8]
Event: 125.814 Thread 0x00000196fc16d000  343       1       sun.misc.URLClassPath$JarLoader::access$600 (5 bytes)
Event: 125.815 Thread 0x00000196fc16d000 nmethod 343 0x00000196801d3350 code [0x00000196801d34a0, 0x00000196801d3598]

GC Heap History (0 events):
No events

Deoptimization events (0 events):
No events

Classes redefined (0 events):
No events

Internal exceptions (10 events):
Event: 0.032 Thread 0x00000196f1cf6000 Exception <a 'java/lang/NoSuchMethodError': Method sun.misc.Unsafe.defineClass(Ljava/lang/String;[BII)Ljava/lang/Class; name or signature does not match> (0x0000000780307cc0) thrown at [C:\jenkins\workspace\8-2-build-windows-amd64-cygwin\jdk8u333\2551\hot
Event: 0.032 Thread 0x00000196f1cf6000 Exception <a 'java/lang/NoSuchMethodError': Method sun.misc.Unsafe.prefetchRead(Ljava/lang/Object;J)V name or signature does not match> (0x0000000780307fa8) thrown at [C:\jenkins\workspace\8-2-build-windows-amd64-cygwin\jdk8u333\2551\hotspot\src\share\vm\
Event: 0.118 Thread 0x00000196f1cf6000 Exception <a 'java/security/PrivilegedActionException'> (0x00000007804ff0f8) thrown at [C:\jenkins\workspace\8-2-build-windows-amd64-cygwin\jdk8u333\2551\hotspot\src\share\vm\prims\jvm.cpp, line 1523]
Event: 0.118 Thread 0x00000196f1cf6000 Exception <a 'java/security/PrivilegedActionException'> (0x00000007804ff308) thrown at [C:\jenkins\workspace\8-2-build-windows-amd64-cygwin\jdk8u333\2551\hotspot\src\share\vm\prims\jvm.cpp, line 1523]
Event: 0.119 Thread 0x00000196f1cf6000 Exception <a 'java/security/PrivilegedActionException'> (0x0000000780509140) thrown at [C:\jenkins\workspace\8-2-build-windows-amd64-cygwin\jdk8u333\2551\hotspot\src\share\vm\prims\jvm.cpp, line 1523]
Event: 0.119 Thread 0x00000196f1cf6000 Exception <a 'java/security/PrivilegedActionException'> (0x0000000780509350) thrown at [C:\jenkins\workspace\8-2-build-windows-amd64-cygwin\jdk8u333\2551\hotspot\src\share\vm\prims\jvm.cpp, line 1523]
Event: 0.150 Thread 0x00000196f1cf6000 Exception <a 'java/security/PrivilegedActionException'> (0x00000007805c19d8) thrown at [C:\jenkins\workspace\8-2-build-windows-amd64-cygwin\jdk8u333\2551\hotspot\src\share\vm\prims\jvm.cpp, line 1523]
Event: 0.150 Thread 0x00000196f1cf6000 Exception <a 'java/security/PrivilegedActionException'> (0x00000007805c1dd0) thrown at [C:\jenkins\workspace\8-2-build-windows-amd64-cygwin\jdk8u333\2551\hotspot\src\share\vm\prims\jvm.cpp, line 1523]
Event: 0.151 Thread 0x00000196f1cf6000 Exception <a 'java/security/PrivilegedActionException'> (0x00000007805c5c28) thrown at [C:\jenkins\workspace\8-2-build-windows-amd64-cygwin\jdk8u333\2551\hotspot\src\share\vm\prims\jvm.cpp, line 1523]
Event: 0.151 Thread 0x00000196f1cf6000 Exception <a 'java/security/PrivilegedActionException'> (0x00000007805c6020) thrown at [C:\jenkins\workspace\8-2-build-windows-amd64-cygwin\jdk8u333\2551\hotspot\src\share\vm\prims\jvm.cpp, line 1523]

Events (10 events):
Event: 13.847 Executing VM operation: RevokeBias
Event: 13.847 Executing VM operation: RevokeBias done
Event: 65.268 Executing VM operation: RevokeBias
Event: 65.268 Executing VM operation: RevokeBias done
Event: 65.268 Executing VM operation: RevokeBias
Event: 65.268 Executing VM operation: RevokeBias done
Event: 125.814 Executing VM operation: RevokeBias
Event: 125.814 Executing VM operation: RevokeBias done
Event: 125.814 loading class org/hyperic/sigar/SigarCacheObject
Event: 125.814 loading class org/hyperic/sigar/SigarCacheObject done


Dynamic libraries:
0x00007ff6c8190000 - 0x00007ff6c81d7000     C:\Program Files (x86)\Common Files\Oracle\Java\javapath\java.exe
0x00007ffb09140000 - 0x00007ffb09349000     C:\Windows\SYSTEM32\ntdll.dll
0x00007ffb07bc0000 - 0x00007ffb07c7d000     C:\Windows\System32\KERNEL32.DLL
0x00007ffb06c50000 - 0x00007ffb06fc9000     C:\Windows\System32\KERNELBASE.dll
0x00007ffb084c0000 - 0x00007ffb0856e000     C:\Windows\System32\ADVAPI32.dll
0x00007ffb07d20000 - 0x00007ffb07dc3000     C:\Windows\System32\msvcrt.dll
0x00007ffb07c80000 - 0x00007ffb07d1e000     C:\Windows\System32\sechost.dll
0x00007ffb083a0000 - 0x00007ffb084c0000     C:\Windows\System32\RPCRT4.dll
0x00007ffb079a0000 - 0x00007ffb07b4c000     C:\Windows\System32\USER32.dll
0x00007ffb06690000 - 0x00007ffb066b6000     C:\Windows\System32\win32u.dll
0x00007ffb085d0000 - 0x00007ffb085f9000     C:\Windows\System32\GDI32.dll
0x00007ffb06ab0000 - 0x00007ffb06bc2000     C:\Windows\System32\gdi32full.dll
0x00007ffb068f0000 - 0x00007ffb0698d000     C:\Windows\System32\msvcp_win.dll
0x00007ffb06990000 - 0x00007ffb06aa1000     C:\Windows\System32\ucrtbase.dll
0x00007ffafad10000 - 0x00007ffafafb5000     C:\Windows\WinSxS\amd64_microsoft.windows.common-controls_6595b64144ccf1df_6.0.22000.120_none_9d947278b86cc467\COMCTL32.dll
0x00007ffb07dd0000 - 0x00007ffb07e01000     C:\Windows\System32\IMM32.DLL
0x00007ffaf62d0000 - 0x00007ffaf62e5000     C:\Program Files\Java\jre1.8.0_333\bin\vcruntime140.dll
0x00007ffaceb30000 - 0x00007ffacebcb000     C:\Program Files\Java\jre1.8.0_333\bin\msvcp140.dll
0x000000005a940000 - 0x000000005b1a1000     C:\Program Files\Java\jre1.8.0_333\bin\server\jvm.dll
0x00007ffb07300000 - 0x00007ffb07308000     C:\Windows\System32\PSAPI.DLL
0x00007ffb02780000 - 0x00007ffb02789000     C:\Windows\SYSTEM32\WSOCK32.dll
0x00007ffafb5f0000 - 0x00007ffafb623000     C:\Windows\SYSTEM32\WINMM.dll
0x00007ffafdb20000 - 0x00007ffafdb2a000     C:\Windows\SYSTEM32\VERSION.dll
0x00007ffb07b50000 - 0x00007ffb07bbf000     C:\Windows\System32\WS2_32.dll
0x00007ffb05720000 - 0x00007ffb05738000     C:\Windows\SYSTEM32\kernel.appcore.dll
0x00007ffafe380000 - 0x00007ffafe390000     C:\Program Files\Java\jre1.8.0_333\bin\verify.dll
0x00007ffaf0ba0000 - 0x00007ffaf0bcb000     C:\Program Files\Java\jre1.8.0_333\bin\java.dll
0x00007ffaf25e0000 - 0x00007ffaf25f8000     C:\Program Files\Java\jre1.8.0_333\bin\zip.dll
0x00007ffb08940000 - 0x00007ffb090f8000     C:\Windows\System32\SHELL32.dll
0x00007ffb04750000 - 0x00007ffb04fb8000     C:\Windows\SYSTEM32\windows.storage.dll
0x00007ffb074a0000 - 0x00007ffb07819000     C:\Windows\System32\combase.dll
0x00007ffb045e0000 - 0x00007ffb04746000     C:\Windows\SYSTEM32\wintypes.dll
0x00007ffb07820000 - 0x00007ffb0790a000     C:\Windows\System32\SHCORE.dll
0x00007ffb08600000 - 0x00007ffb0865d000     C:\Windows\System32\shlwapi.dll
0x00007ffb06550000 - 0x00007ffb06571000     C:\Windows\SYSTEM32\profapi.dll
0x00007ffaedd60000 - 0x00007ffaedd7c000     C:\Program Files\Java\jre1.8.0_333\bin\net.dll
0x00007ffb05b50000 - 0x00007ffb05bb7000     C:\Windows\system32\mswsock.dll
0x00007ffae9a50000 - 0x00007ffae9a63000     C:\Program Files\Java\jre1.8.0_333\bin\nio.dll
0x00007ffb05d90000 - 0x00007ffb05da8000     C:\Windows\SYSTEM32\CRYPTSP.dll
0x00007ffb05680000 - 0x00007ffb056b5000     C:\Windows\system32\rsaenh.dll
0x00007ffb05c40000 - 0x00007ffb05c69000     C:\Windows\SYSTEM32\USERENV.dll
0x00007ffb05f10000 - 0x00007ffb05f37000     C:\Windows\SYSTEM32\bcrypt.dll
0x00007ffb06bd0000 - 0x00007ffb06c4f000     C:\Windows\System32\bcryptprimitives.dll
0x00007ffb05db0000 - 0x00007ffb05dbc000     C:\Windows\SYSTEM32\CRYPTBASE.dll
0x00007ffb05210000 - 0x00007ffb0523d000     C:\Windows\SYSTEM32\IPHLPAPI.DLL
0x00007ffb07130000 - 0x00007ffb07139000     C:\Windows\System32\NSI.dll
0x00007ffb01ac0000 - 0x00007ffb01ad9000     C:\Windows\SYSTEM32\dhcpcsvc6.DLL
0x00007ffb02630000 - 0x00007ffb0264e000     C:\Windows\SYSTEM32\dhcpcsvc.DLL
0x00007ffb05280000 - 0x00007ffb05368000     C:\Windows\SYSTEM32\DNSAPI.dll
0x0000000010000000 - 0x0000000010070000     D:\ServerAgent-2.2.3\lib\sigar-amd64-winnt.dll
0x00007ffb086f0000 - 0x00007ffb0888a000     C:\Windows\System32\ole32.dll
0x00007ffb07050000 - 0x00007ffb07126000     C:\Windows\System32\OLEAUT32.dll
0x00007ffafbc90000 - 0x00007ffafbcdf000     C:\Windows\SYSTEM32\pdh.dll
0x00007ffafcd80000 - 0x00007ffafcd9a000     C:\Windows\SYSTEM32\NETAPI32.dll
0x00007ffb05200000 - 0x00007ffb0520c000     C:\Windows\SYSTEM32\NETUTILS.DLL
0x00007ffb013e0000 - 0x00007ffb01408000     C:\Windows\SYSTEM32\SRVCLI.DLL
0x00007ffafe8b0000 - 0x00007ffafead1000     C:\Windows\SYSTEM32\dbghelp.dll

VM Arguments:
java_command: D:\ServerAgent-2.2.3\startAgent.bat\..\CMDRunner.jar --tool PerfMonAgent
java_class_path (initial): D:\ServerAgent-2.2.3\startAgent.bat\..\CMDRunner.jar
Launcher Type: SUN_STANDARD

Environment Variables:
JAVA_HOME=C:\Program Files\Java\jdk1.8.0_333
CLASSPATH=D:\Software\apache-jmeter-5.4.3\lib\ext\ApacheJMeter_core.jar; D:\Software\apache-jmeter-5.4.3\lib\jorphan.jar;
PATH=C:\Program Files (x86)\Common Files\Oracle\Java\javapath;D:\VMware Workstation\bin\;C:\Windows\system32;C:\Windows;C:\Windows\System32\Wbem;C:\Windows\System32\WindowsPowerShell\v1.0\;C:\Windows\System32\OpenSSH\;C:\Program Files (x86)\ATI Technologies\ATI.ACE\Core-Static;D:\Software\Bandizip\Bandizip;D:\Software\LoadRunner\strawberry-perl\perl\bin;D:\Git\cmd;D:\Software\apache-jmeter-5.4.3\bin;C:\Program Files\Java\jdk1.8.0_333\bin;C:\Program Files\Java\jdk1.8.0_333\jre\bin;C:\Users\user\AppData\Local\Programs\Python\Python311\Scripts\;C:\Users\user\AppData\Local\Programs\Python\Python311\;C:\Users\user\AppData\Local\Programs\Python\Python310\Scripts\;C:\Users\user\AppData\Local\Programs\Python\Python310\;C:\Users\user\AppData\Local\Microsoft\WindowsApps;D:\Software\JetBrains\IntelliJ IDEA 2022.1.1\bin;C:\Users\user\AppData\Local\Programs\Microsoft VS Code\bin;C:\Users\user\AppData\Local\Programs\Fiddler;C:\Program Files\JetBrains\PyCharm 2022.1.1\bin
USERNAME=user
OS=Windows_NT
PROCESSOR_IDENTIFIER=Intel64 Family 6 Model 58 Stepping 9, GenuineIntel


---------------  S Y S T E M  ---------------

OS: Windows 11 , 64 bit Build 22000 (10.0.22000.708)

CPU:total 8 (initial active 8) (4 cores per cpu, 2 threads per core) family 6 model 58 stepping 9, cmov, cx8, fxsr, mmx, sse, sse2, sse3, ssse3, sse4.1, sse4.2, popcnt, avx, aes, clmul, erms, ht, tsc, tscinvbit, tscinv

Memory: 4k page, physical 12545964k(4022596k free), swap 17264556k(4002328k free)

vm_info: Java HotSpot(TM) 64-Bit Server VM (25.333-b02) for windows-amd64 JRE (1.8.0_333-b02), built on Apr 25 2022 22:49:11 by "java_re" with MS VC++ 15.9 (VS2017)

time: Tue Jun  7 11:21:09 2022
timezone: 中国标准时间
elapsed time: 125.849403 seconds (0d 0h 2m 5s)