本帖已被设为精华帖!
@ 群主 我是自己看的,才刚刚开始,很浅显,如果觉得没有意思,我不介意删掉吖
看起来 iOS 的 instruments 很强大很全面的样子,可以在 app 运行时搜集 performance data 或者其他跟踪的数据。同时可以通过组合参数的方式来跟踪数据,例如如果 app 是因为网络链接导致 memory 过高,那就用 Allocations 和 Connections 两个 instrument 组合,来确认导致 memory 过高的某个网络连接。
Instrument 工具用独立的数据搜集模块来搜集一段时间内的数据。每一个 instrument 搜集并显示不同类型的数据,例如 file access,memory use,等等。Instruments 其实就是一系列的标准化的工具,用户也可以用 DTrace 来自定义工具搜集其他类型的数据。
注:iTunes、DVD Player 以及用 QuickTime 的 apps,涉及敏感信息,所以不能通过 DTrace 搜集数据。
Launching Instruments
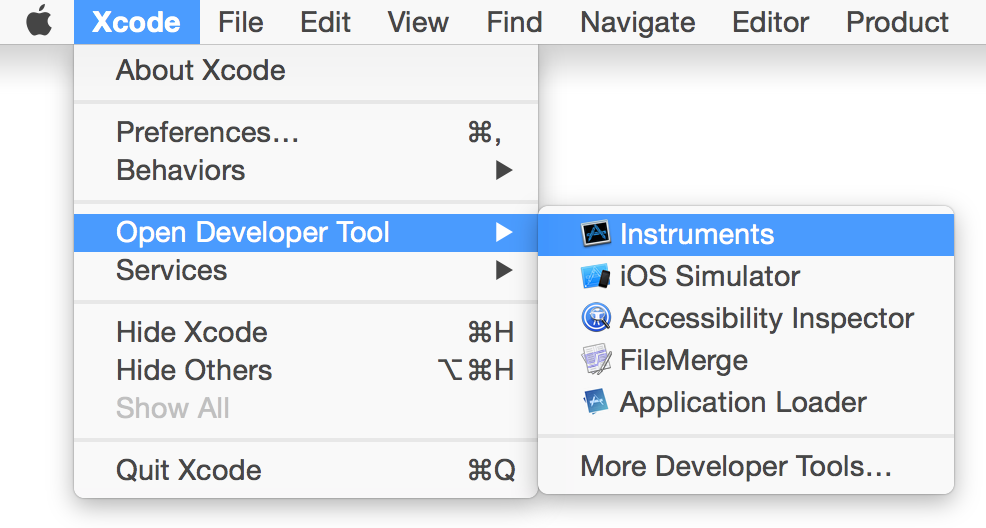
方法一:从 Xcode 中打开
Xcode -> Developer Tool -> Instruments
方法二:building 时运行 Instruments
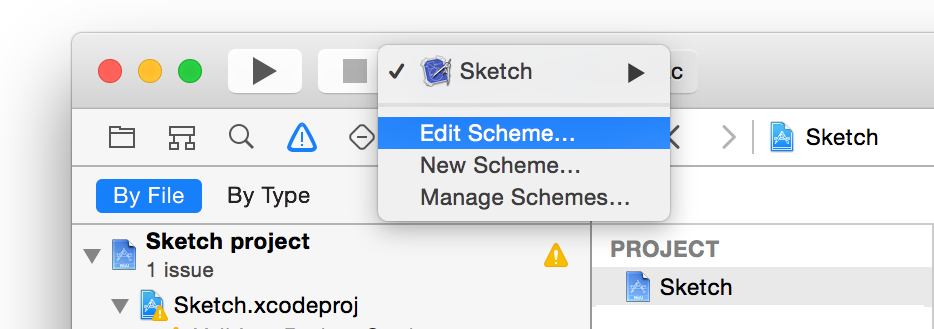

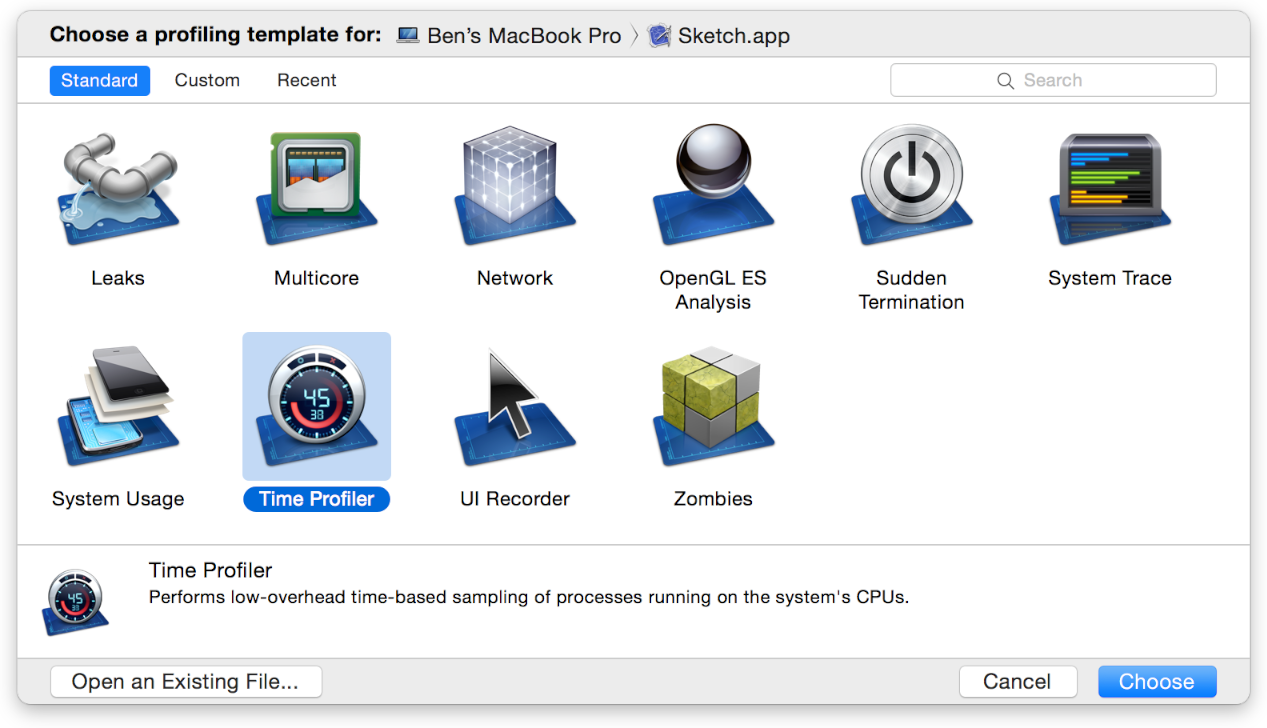
- 在 Instruments 弹出框中选择一个 Instrument 模版
- 运行程序 building,长按 run 按钮选择 profile 之后会弹出 instruments 选择模版开始
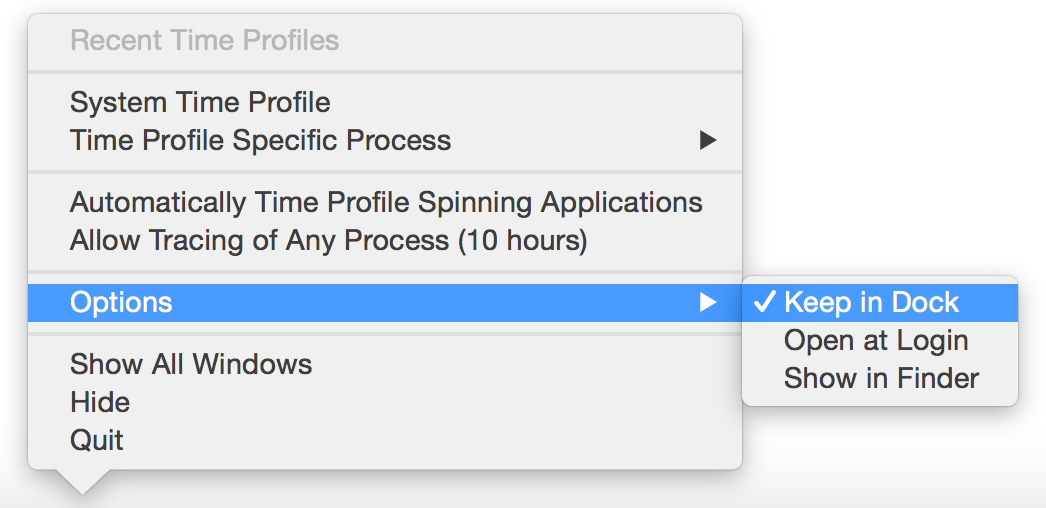
方法三:从 Dock 上运行 Instruments
用以上方法之一打开之后,右键 Dock 设置
Gathering Your First Data
每个 Instrument 都是不一样的,但有一个总体流程用于搜集 app 的数据:
- 打开 Instruments
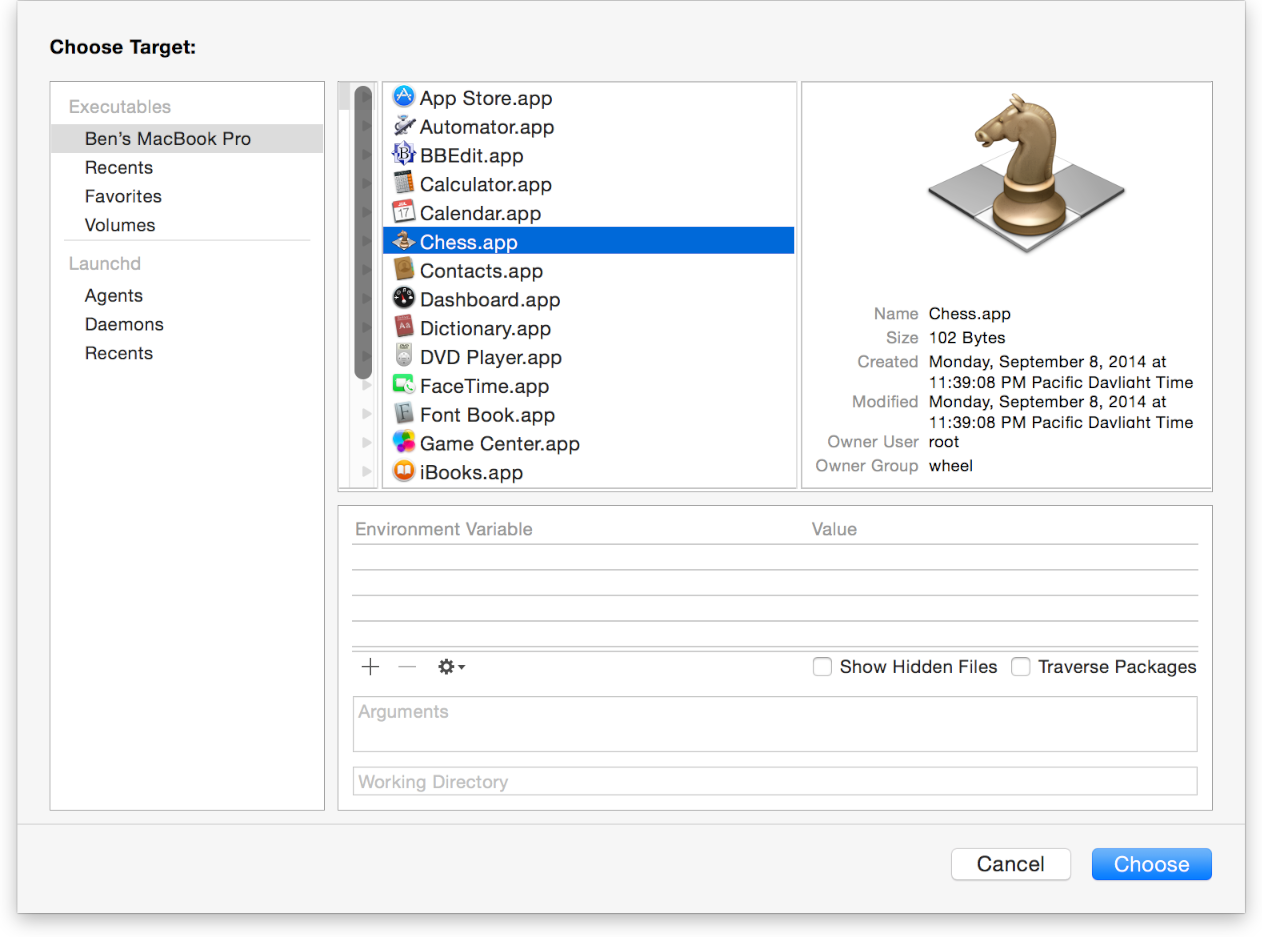
- 选择目标设备以及 app
- 选择跟踪模版
- 搜集 app 的信息
- 检查搜集的信息
