其中数据采集部分主要参考了:
@testly Android 性能测试实践 (二) 实时监控工具
@kasi 《Android 性能测试初探》合集
以及其他一些同学的文章,具体的可能我也忘记了,sry
借鉴社区一些同学的 idea,最终做成了这个工具,非常感谢!!!
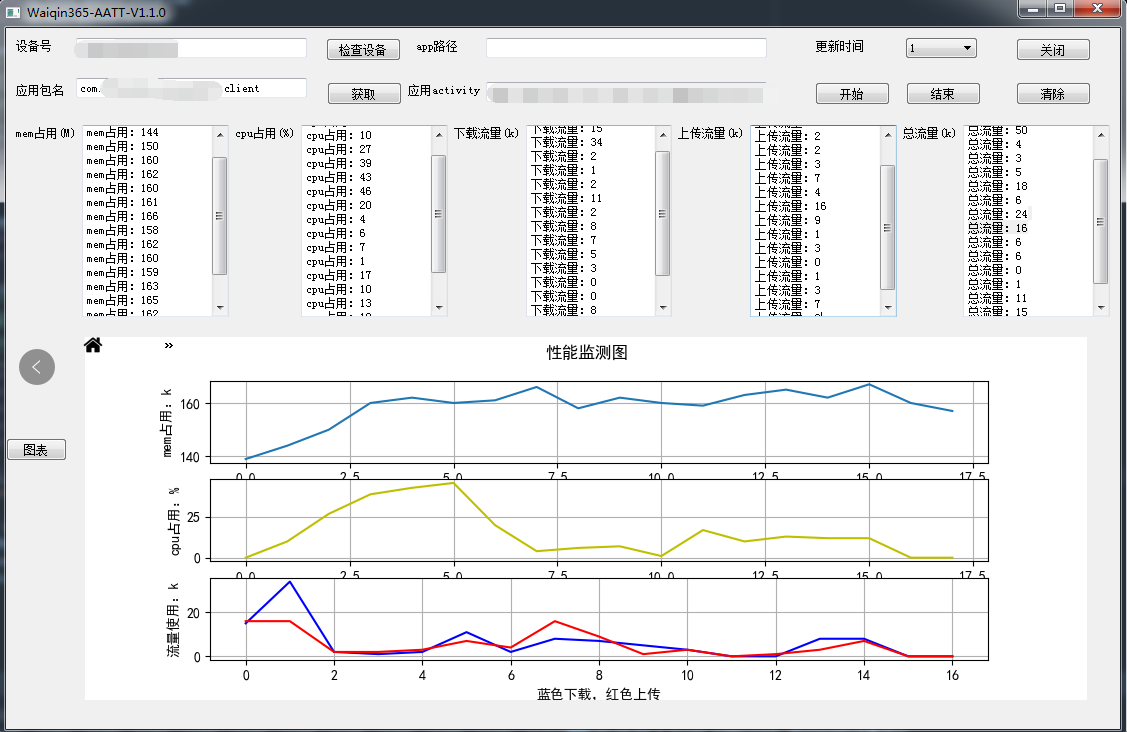
前阵子公司发布一款新应用,第一次发布应用市场,过程比较坎坷,查看百度反馈的监测报告于是想着自己做一款 android 性能监控工具,由于之前写了 部署 工具,所以继续用 python+PyQt 做了一款 GUI 工具,V1.1.0 版本主界面如下:
其中数据采集部分主要参考了:
@testly Android 性能测试实践 (二) 实时监控工具
@kasi 《Android 性能测试初探》合集
以及其他一些同学的文章,具体的可能我也忘记了,sry
借鉴社区一些同学的 idea,最终做成了这个工具,非常感谢!!!
工具目前版本主要监控三个指标:mem、cpu、流量(上传和下载),后面有需求会加上其他指标
具体的数据采集,上面的链接的几篇文章已经说得很清楚了,我就不再狗尾续貂
具体做法是,将这些方法放在 adb_commonn.py 文件中,在需要的时候引用即可
def mem():
  xxxxx
def cpu():
  xxxx
def flow():
  xxxx
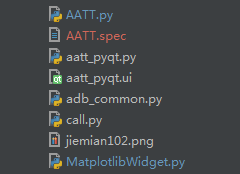
工具主要有几部分构成:
其中:
AATT.py 主要逻辑实现
aatt_pyqt.py 主要是页面,由下面.ui 文件转换而来
aatt_pyqt.ui QT Designer 生成的文件
adb_common.py 即上面说的封装的数据采集的方法
MatplotlibWidget.py 绘图文件,用来定义绘图的逻辑
其中点击 pushbutton 获取信息、下拉框选择信息,这些简单的逻辑在上篇 部署 中已经讲过了,这篇文章也不再赘述了
主要讲过程中主要遇到了两个问题:
1.实时向 textedit 中添加最新获取到的数据
2.图表的显示
加入 QTimer 主要是为了解决,在写数据的过程中,不断往原有数据上 append 新采集到数据的问题,同时不至于是应用无响应。
初始化一个定时器,把定时器的 timeout 信号和 slotadd() 槽函数连接。
self.timer = QTimer(self)
self.timer.timeout.connect(self.slotadd)
slotadd() 往五个 textedit 中写数据
由于返回的数据是一个列表,所以每次只需要取最新的即最后一个数据即可。
def slotadd(self):
       '''
       往mem、cpu、flow写数据
       :return:
       '''
       memlist = adb.mem()
       mem = 'mem占用:'+ str(memlist[-1])
       cpulist = adb.cpu()
       cpu = 'cpu占用:'+ str(cpulist[-1])
       self.ui.mem.append(mem)
       self.ui.cpu.append(cpu)
       (recevice,send,allflow)=adb.getflow()
       receflow = '下载流量:' + str(int(recevice[-1]))
       sendflow = '上传流量:' + str(int(send[-1]))
       alladd = '总流量:' + str(int(allflow[-1]))
       self.ui.recv.append(receflow)
       self.ui.send.append(sendflow)
       self.ui.all.append(alladd)
点击开始按钮,启动定时器,并使开始按钮失效
def startTimer(self):
    '''
    设置时间间隔并启动定时器
    :return:
    '''
    self.timer.start(self.wait_time())
    self.ui.start.setEnabled(False)
    self.ui.end.setEnabled(True)
点击结束按钮,停止定时器,并使开始按钮生效。
def endTimer(self):
    self.timer.stop()
    self.ui.start.setEnabled(True)
流量采集部分,需要将两个采集到的结果相减,才会得到这段时间内的流量,所以相对其他指标直接获取的稍有区别:
#获取流量
receive = []
sendflow = []
all = []
def flow():
    cmd = 'adb -s '+ get_devices() +' shell cat /proc/net/xt_qtaguid/stats | findstr '+ uid()
    print (cmd)
    flow_info = subprocess.Popen(cmd, shell=True, stdout=subprocess.PIPE, stderr=subprocess.PIPE).stdout.readlines()
    down = 0
    up = 0
    if len(flow_info)>= 1:
        for flow in flow_info:
            down =down + int(flow.split()[5])
            up = up+ int(flow.split()[7])
        receive.append(down)
        sendflow.append(up)
    print (receive,sendflow)
    return (receive,sendflow)

def getflow():
    (receive,sendflow) = flow()
    recev = []
    send = []
    allflow = []
    print(len(receive))
    for i in range(len(receive)-1):
        recev.append((int(receive[i+1]) - int(receive[i]))//1024)
        send.append((int(sendflow[i+1]) - int(sendflow[i]))//1024)
        allflow.append(recev[i]+send[i])
    print(recev,send,allflow)
    return recev,send,allflow
Matplotlib 是 python 常用的绘图模块,提供了一套与 MATLAB 相似的命令 API,用来交互式的绘图,非常方便。
新增一个 MatplotlibWidget.py 文件,创建 FigureCanvas 类,在初始化过程中建立一个空白图像。
class MyMplCanvas(FigureCanvas):
    """FigureCanvas的最终的父类其实是QWidget。"""

    def __init__(self, parent=None, width=5, height=4, dpi=100):

        # 配置中文显示
        plt.rcParams['font.family'] = ['SimHei']  # 用来正常显示中文标签
        plt.rcParams['axes.unicode_minus'] = False  # 用来正常显示负号

        self.fig = plt.figure(figsize=(width, height), dpi=dpi)  # 新建一个figure

        self.axes = self.fig.add_subplot(111)  # 建立一个子图,如果要建立复合图,可以在这里修改

        self.axes.hold(False)  # 每次绘图的时候不保留上一次绘图的结果
        FigureCanvas.__init__(self, self.fig)
        self.setParent(parent)

        '''定义FigureCanvas的尺寸策略,这部分的意思是设置FigureCanvas,使之尽可能的向外填充空间。'''
        FigureCanvas.setSizePolicy(self,
                                   QSizePolicy.Expanding,
                                   QSizePolicy.Expanding)
        FigureCanvas.updateGeometry(self)
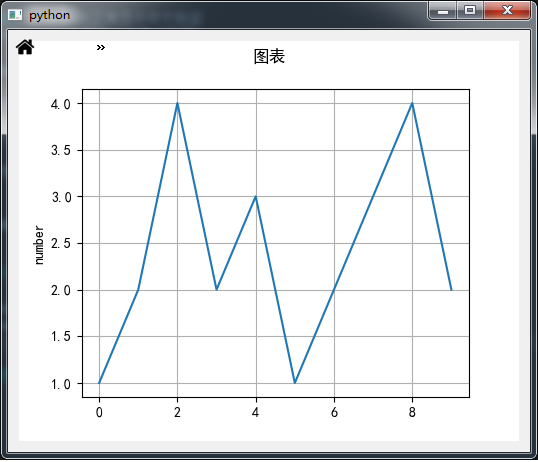
定义绘图函数,调用这个函数可以在上面所创建的空白图像中绘图。
备注:这边由于演示需要,所以稍微更改了下图片显示的逻辑
实际中将 a 换成 adb_common 文件返回的 各指标即可
def start_static_plot(self):

    self.fig.suptitle('图表')
    a=[1,2,4,2,3,1,2,3,4,2]
    self.axes.plot(a)
    self.axes.set_ylabel('number')
    self.axes.grid(True)
这部分主要把上面的绘图类和工具栏封装到 MatplotlibWidget 中,只需要调用 MatplotlibWidget 这个类就可以实现绘图功能
class MatplotlibWidget(QWidget):
    def __init__(self, parent=None):
        super(MatplotlibWidget, self).__init__(parent)
        self.initUi()

    def initUi(self):
        self.layout = QVBoxLayout(self)
        self.mpl = MyMplCanvas(self, width=5, height=4, dpi=100)
        self.mpl.start_static_plot()
        self.mpl_ntb = NavigationToolbar(self.mpl, self)  # 添加完整的 toolbar

        self.layout.addWidget(self.mpl)
        self.layout.addWidget(self.mpl_ntb)
if __name__ == '__main__':
    app = QApplication(sys.argv)
    ui = MatplotlibWidget()
    ui.mpl.start_static_plot()  # 测试静态图效果
    ui.show()
    sys.exit(app.exec_())
在 QT Designer 中右击提升窗口部件,新建一个 QWidget 类,名称和头文件均为 MatplotlibWidget

在.ui 文件中加入 widget 并升级
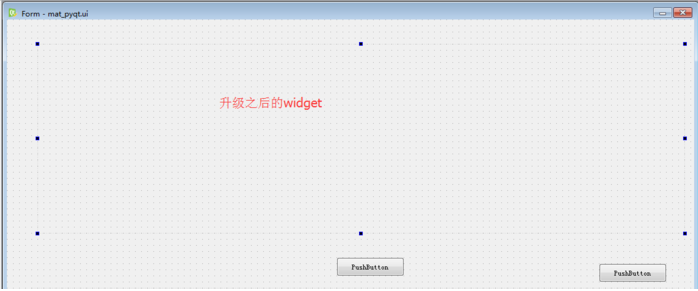
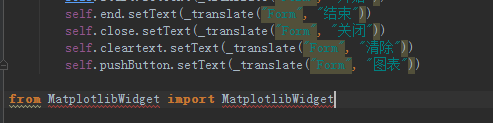
这个转换生成的 ui 文件,后最下方会有一行
from MatplotlibWidget import MatplotlibWidget
下面即 AATT.py 部分代码展示
初始化模型
class Main(QMainWindow,Ui_Form):

    def __init__(self,parent=None):
        super(Main,self).__init__(parent)
        self.ui = Ui_Form()
        self.ui.setupUi(self)
        self.setWindowTitle('Waiqin365-AATT-V1.1.0')
        self.ui.mem_plot.setVisible(False)
        self.ui.checkdev.clicked.connect(self.setdevices)
        self.ui.getpackage.clicked.connect(self.setpackage)
        self.ui.cleartext.clicked.connect(self.clearall)

        self.ui.comboBox.activated.connect(self.wait_time)

        #初始化一个定时器
        self.timer = QTimer(self)
        self.timer.timeout.connect(self.slotadd)
        self.ui.start.clicked.connect(self.startTimer)
        self.ui.end.clicked.connect(self.endTimer)

        self.ui.mem_plot.setVisible(False)
初始化中隐藏图像,设置按钮的触发操作,同时使得图像可见并出发绘图函数
@pyqtSlot()
def on_pushButton_clicked(self):
    self.ui.mem_plot.setVisible(True)
    self.ui.mem_plot.mpl.start_static_plot()
运行测试程序:
if __name__ == "__main__":
    import sys

    app = QApplication(sys.argv)
    ui = Main()
    ui.show()
    sys.exit(app.exec_())
结果如下:
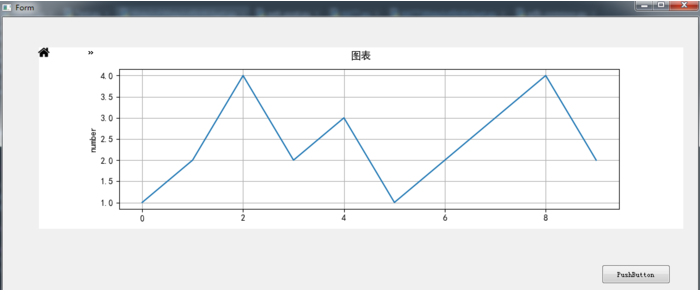
备注:这边的图片,是上面直接写的 a,实际显示的 adb_common 返回的各列表的值
目前工具优化到 V1.1.0 版本,但是仍存在很多不足的情况,目前遇到的问题:
后面有时间将一一攻破这些难题,欢迎有想法的同学多提提意见
最后再次致谢
