「原创声明:保留所有权利,禁止转载」
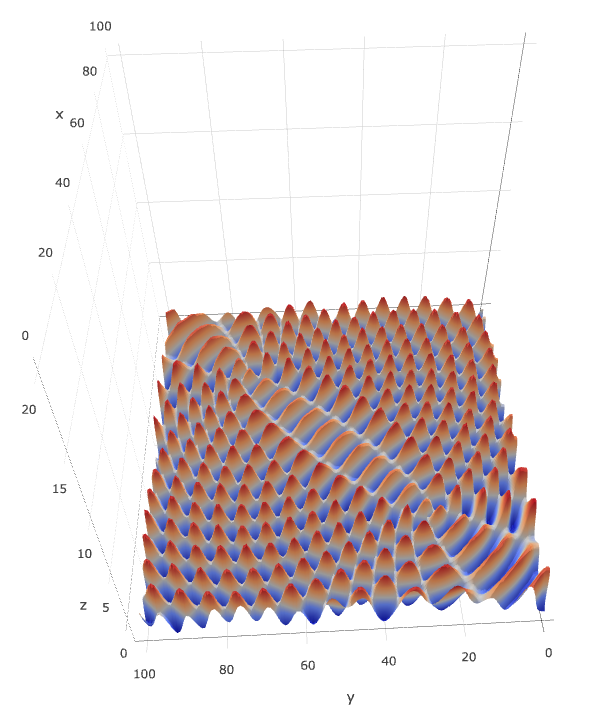
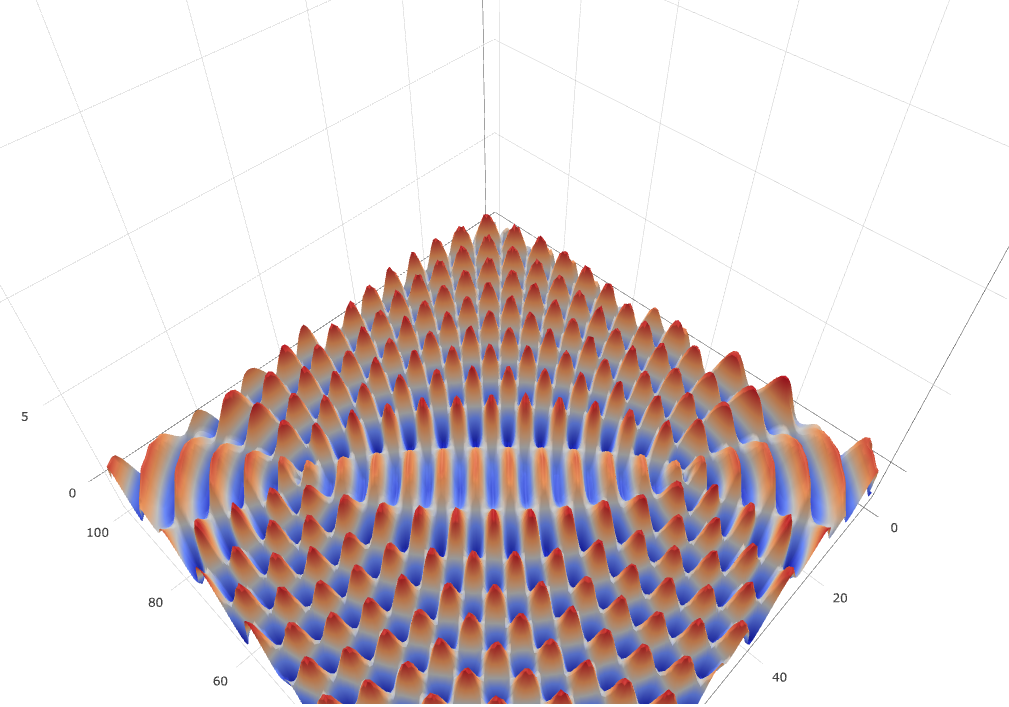
本人在学习完制作双波源干涉现象的的二维 Contour Plots 图像之后,发现 plotly 还有 3D 图像制作,也就是 3D Surface Plots,这个更能展示双波源干涉现象的结果,果然学之。中间有些地方要说明一下,3D Surface Plots 图表默认的底部是正方形,所以我采用了 100*100 的干涉图,然后加上一层透明的图标,让图像压扁,不然图标的上下限就是波动位置,看起来非常不雅观。
下面分享代码和结果:
下面是 python 部分的代码:
#!/usr/bin/python
# coding=utf-8

import plotly.plotly

z = []
with open("/Users/Vicky/Documents/workspace/fission/long/intervene.log") as apidata:
    for i in apidata:
        data = i.split("\n")[0].split(",")
        z.append(data)
matrix = [[20 for zij in zi] for zi in z]#为了让立体图压扁
plotly.offline.plot([
     dict(
            z=z,
            type="surface"
    ),
    dict(
            z=matrix,
            showscale=False,
            opacity=0.01,#透明度
            type="surface"
    )
], filename="2222.html")
下面是 java 部分的代码,是为了生成数据:
package practise;

import java.awt.Point;
import java.util.ArrayList;
import java.util.List;
import source.SourceCode;

public class Intervene extends SourceCode {
    public List<List<Double>> data = new ArrayList<>();

    public static void main(String[] args) {
        Intervene intervene = new Intervene();
        intervene.testDemo001();
    }

    public void testDemo001() {
        Point point1 = new Point(25, 25);
        Point point2 = new Point(75, 75);
        int lamda = 6;
        for (int i = 0; i < 100; i++) {// y 轴
            List<Double> distance = new ArrayList<>();
            for (int j = 0; j < 100; j++) {// x 轴
                Point point = new Point(j, i);
                double x = point.distance(point1) % lamda / lamda;
                double y = point.distance(point2) % lamda / lamda;
                double xx = Math.sin(x * 2 * Math.PI);
                double yy = Math.sin(y * 2 * Math.PI);
                distance.add(xx + yy);
            }
            data.add(distance);
        }
        StringBuffer content = new StringBuffer();
        int size = data.size();
        for (int i = 0; i < size; i++) {
            String text = data.get(i).toString();
            text = text.substring(1, text.length() - 1);
            if (i == 0)
                content.append(text);
            content.append(LINE + text);
        }
        logLong("intervene.log", content.toString());
    }
}
下面是 3D Surface Plots 图的截图:
技术类文章精选
- java 一行代码打印心形
- Linux 性能监控软件 netdata 中文汉化版
- 接口测试代码覆盖率(jacoco)方案分享
- 性能测试框架
- 如何在 Linux 命令行界面愉快进行性能测试
- 图解 HTTP 脑图
- 将 swagger 文档自动变成测试代码
- 五行代码构建静态博客
- 基于 java 的直线型接口测试框架初探
- 单点登录性能测试方案
非技术文章精选
TesterHome 为用户提供「保留所有权利,禁止转载」的选项。
除非获得原作者的单独授权,任何第三方不得转载标注了「原创声明:保留所有权利,禁止转载」的内容,否则均视为侵权。
具体请参见TesterHome 知识产权保护协议。
如果觉得我的文章对您有用,请随意打赏。您的支持将鼓励我继续创作!
暂无回复。