脚本名称:基于 matplotlib 绘图
应用场景:用于测试报告、微信/钉钉推送
from matplotlib import pyplot as plt

def create_picture(color, result):
    # 设置图片字体(假如字体不存在,请参考https://blog.csdn.net/weixin_46019681/article/details/125307781)
    plt.rcParams['font.sans-serif'] = 'SimHei'
    plt.axis('off')

    # 画图
    plt.plot([0, 20, 20, 0, 0], [10, 10, 5, 5, 10], color=color)
    plt.fill([0, 20, 20, 0], [10, 10, 5, 5], color=color, alpha=0.3)
    plt.plot([0, 0, 20, 20, 0], [10, 0, 0, 10, 10], color=color)
    plt.fill([0, 0, 20, 20, 0], [10, 0, 0, 10, 10], color='w', alpha=0.3)
    plt.text(2.8, 1.8, result, fontsize=50, color=color)
    plt.text(1.8, 7, 'OA系统', fontsize=25, color='w')
    plt.text(13, 7, '接口测试', fontsize=25, color='black')

    # 生成图片
    picname = 'draw.jpg'
    plt.savefig(picname, bbox_inches='tight', pad_inches=0)
    plt.show()

if __name__ == '__main__':
    # create_picture(color="green", result="测试通过")
    create_picture(color="red", result="测试不通过")

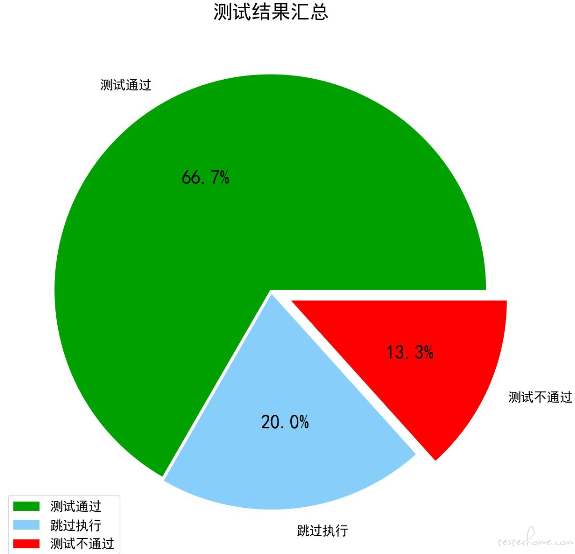
import matplotlib.pyplot as plt

def create_picture():
    # 设置图片大小、字体、标题、图例
    plt.rcParams['font.sans-serif'] = 'SimHei'
    plt.figure(figsize=(20, 20))

    # 设置每块区域的标签
    labels = ['测试通过', '跳过执行', '测试不通过']
    explode = [0.01, 0.01, 0.10]
    values = [10, 3, 2]
    colors = ['#00A000', '#87CEFA', '#FF0000']

    # 设置标题、图例、标签字体、数值字体大小
    _, l_text, p_text = plt.pie(values, explode=explode, labels=labels, autopct='%1.1f%%', colors=colors)
    for t in l_text:
        t.set_size(20)
    for t in p_text:
        t.set_size(30)
    plt.title(u'测试结果汇总', fontsize=30)
    plt.legend(fontsize=20)

    # 保存图片
    plt.savefig('result.jpg', bbox_inches='tight')
    plt.show()

if __name__ == '__main__':
    create_picture()

