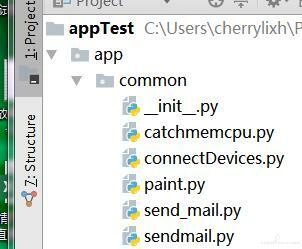
Common:公共功能代码,用来连接测试机,
catchmenCpu:用来将抓取的数据保存在 csv 文件中,
paint 将 csv 中的数据读取出来,使用 pylab 绘制成图片并保存到本地,
send_mail 发送邮件

1、connectDevices:通过 subprocess.popen 执行 adb 命令,连接测试机,测试机型写在配置文件中
该 ui 自动化平台侧重点是在功能测试的同时抓取 cpu 和 mem 等性能数据并进行分析,目前已经实现对一些卡顿页面进行多机器性能测试的对比和分析,通统计运行时异常
采用 python3+appium+unittest+beautifulReport+matplib+pageObject 模式
unittest---python 自带的单元测试框架,提供了创建测试用例,测试套件及批量执行的方案
包含:testCase,testSuite(测试套件),testRunner(执行测试)
用例的执行顺序:uinittest 框架默认加载测试用例的顺序是根据 AscII 码的顺序,
unittest 断言:
assertEqual(u1,u2)---断言相同
assertNotEqual(u1,u2)----断言不相同
assertTrue(expr,mag)----验证是否是 true
assertFalse(expr,msg)----验证是否是 false
一、包含以下部分
Common:公共功能代码,用来连接测试机,
catchmenCpu:用来将抓取的数据保存在 csv 文件中,
paint 将 csv 中的数据读取出来,使用 pylab 绘制成图片并保存到本地,
send_mail 发送邮件

1、connectDevices:通过 subprocess.popen 执行 adb 命令,连接测试机,测试机型写在配置文件中
import subprocess
import time
import app.config.globalparameter as gl
def connectDevice():
    ipport=gl.ipport()
    for i in range(5):
        time.sleep(3)
    connectTask=subprocess.Popen('adb connect '+ipport,shell=True,stdin=subprocess.PIPE,stdout=subprocess.PIPE,stderr=subprocess.STDOUT)
    connectResult=connectTask.stdout.read().decode()
    print(connectResult)
    if 'connected' in connectResult and 'offline' not in connectResult:
        time.sleep(3)
        return True
2、catMemcpu---抓取 cpu 和 mem,使用 os.open(adb 命令)
主要的 adb 命令:adb shell dumpsys cpuinfo|findstr com.pptv.tvsports
adb shell dumpsys meminfo|findstr com.pptv.tvsports
使用 xlwt,xlrd 和 xlutils 读取 csv 数据并写数据
3、paint 使用 matplib 绘制折线图,并保存在本地
#coding=utf-8
import matplotlib.pyplot as plt
import matplotlib.image as mping
from datetime import datetime as dt
import matplotlib.dates as mdates
import xlrd
from pylab import *
import app.config.globalparameter as gl
def paint(picname,title):
    #获取图片所在路径
    global newreportpath
    newreportpath=gl.newreport()
    print('.........draw picture.......')
    plt.figure(picname)
    filename=newreportpath+picname+'.csv'
    #获取csv中的数据,转化为x,y轴数据
    x, y = get_weight_data(filename)
    x = range(len(x))
    maxy=int(max(y))
    average=int(sum(y)/len(y))
    #plot绘制折线图,设置标题,线条尺寸和颜色
    plt.plot(x, y, label=title, linewidth=1, color='r')
    if 'CPU' in picname:
        # 设置图片的名称
        plt.title('Max:'+str(maxy)+'% Average:'+str(average)+'%')
        #设置x轴的标签
        plt.xlabel(title)
        #设置y轴标签
        plt.ylabel('CPU Percent')
    else:
        plt.title('Max:'+str(maxy)+'KB Average:'+str(average)+'KB')
        plt.xlabel(title)
        plt.ylabel('PSS(KB)')
    #设置y轴高度
    if picname=='a':
        plt.ylim(0.0,400000)
    elif picname=='MEM_a':
        plt.ylim(0.0,450000)
    elif 'CPU' in picname:
        plt.ylim(0.0,250)
    else:
        plt.ylim(0.0,150000)
    #将图片保存在本地
    plt.savefig(newreportpath+picname+'.png')
#读取csv文件的数据
def get_weight_data(filename):
    time=[]
    weight=[]
    f=xlrd.open_workbook(filename)
    sheet_one=f.sheet_by_index(0)
    ncolsn=sheet_one.ncols
    nrowsn=sheet_one.nrows
    for i in range(nrowsn):
        nrowdata=sheet_one.cell(i,0).value
        time.append(float(nrowdata))
        ncoldata=sheet_one.cell(i,1).value
        weight.append(float(ncoldata))
    return time,weight
4、send_email,使用 stmplib 发送邮件
自定义 html,建一个空的 html,将测试机器信息,测试结果,cpu,mem 绘制图片写在 html 中,然后发送
二、Config---配置文件,
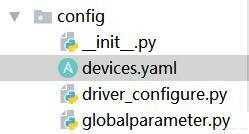
devices.yaml 测试机配置信息,driver_configure webdriver 配置信息,gloalparameter 公用的配置项

devices.yaml--测试文件的配置信息
driver_configure 负责连接手机,并启动测试 app
globalparameter
log----nnlog 测试机运行时日志,运行日志,错误日志
三、pages
Pageobject:设计模式,对页面元素操作的封装
base page:对页面常用操作的封装,如查找元素,输入框等,每个页面操作都继承这个基类
四、testCases
testInterfaceCase:测试用例的基类,所有测试用例都继承这个基类
继承 unittest,包含 setupClass,一个类测试前执行一次,tearDown 类执行完后执行一次
五、testRunner 运行类
基本思路:
1、封装好所有的类,方法之后
2、首先判断测试机是否连接,未连接线连接机器,如果连接失败则退出程序报错
3、生成测试报告,log 的目录,
4、将测试 case 加载到 suite 测试套件中
5、开启一个进程抓取日志
6、开启一个定时器抓取 CPU 和 mem
7、运行测试用例,并生成 beautifulReport 测试报告
8、测试完成后,停止抓取 cpu,mem
9、将抓取的 cpu,mem 绘制成图片
10、停止抓取 log,分析 log
11、发送测试报告邮件
