1.下载 prometheus
wget http://file.ethlink.cn/tools/prometheus.tar.gz
2.解压 prometheus
tar -zxvf prometheus.tar.gz
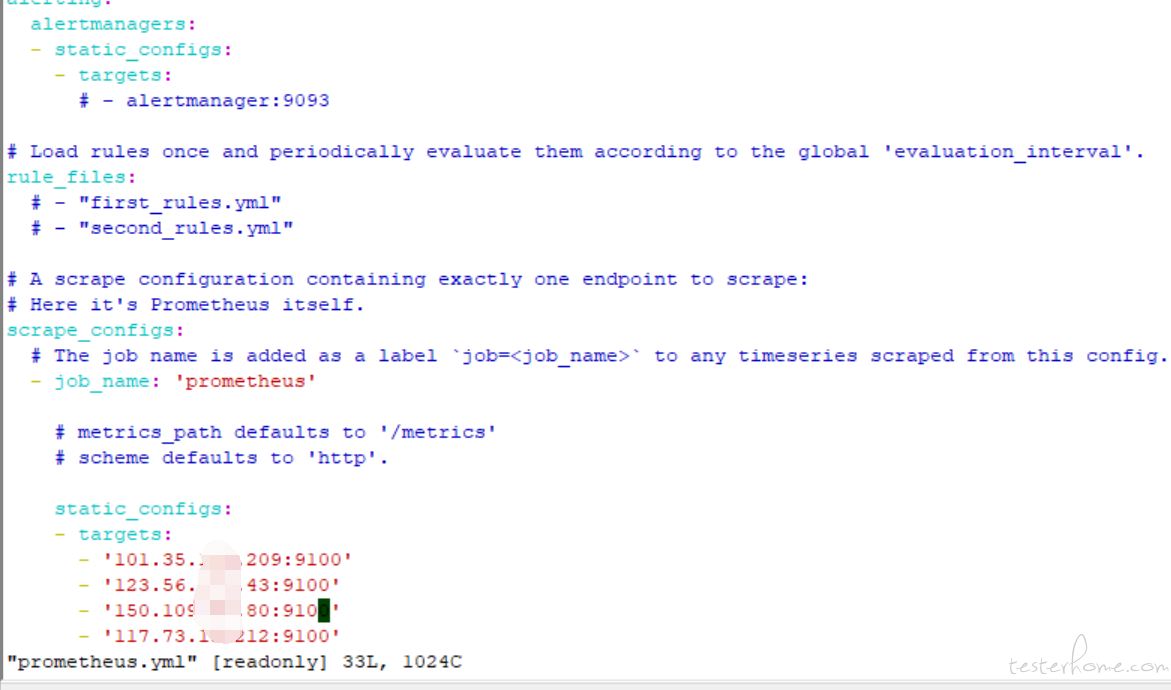
3.配置监听地址
vim prometheus.yml
4.启动 prometheus
nohup ./prometheus &> daemon &
在各个需要监听的服务器上安装 node_exporter。
1.下载 node_exporter
wget https://github.com/prometheus/node_exporter/releases/download/v1.0.1/node_exporter-1.0.1.linux-amd64.tar.gz
2.解压 node_exporter
tar -zxvf node_exporter-1.0.1.linux-amd64.tar.gz
3.单节点后台启动
nohup ./node_exporter &
上面的 node_exporter 在每一台待监听机器上都要启动
部署 prometheus
1.下载 prometheus
wget http://file.ethlink.cn/tools/prometheus.tar.gz
2.解压 prometheus
tar -zxvf prometheus.tar.gz
3.配置监听地址
vim prometheus.yml
4.启动 prometheus
nohup ./prometheus &> daemon &
1.下载 grafana
wget http://file.ethlink.cn/tools/grafana_7.3.4_amd64.deb
2.编译 grafana
dpkg -i grafana_7.3.4_amd64.deb
dpkg -i grafana_7.3.4_amd64.deb
执行两次
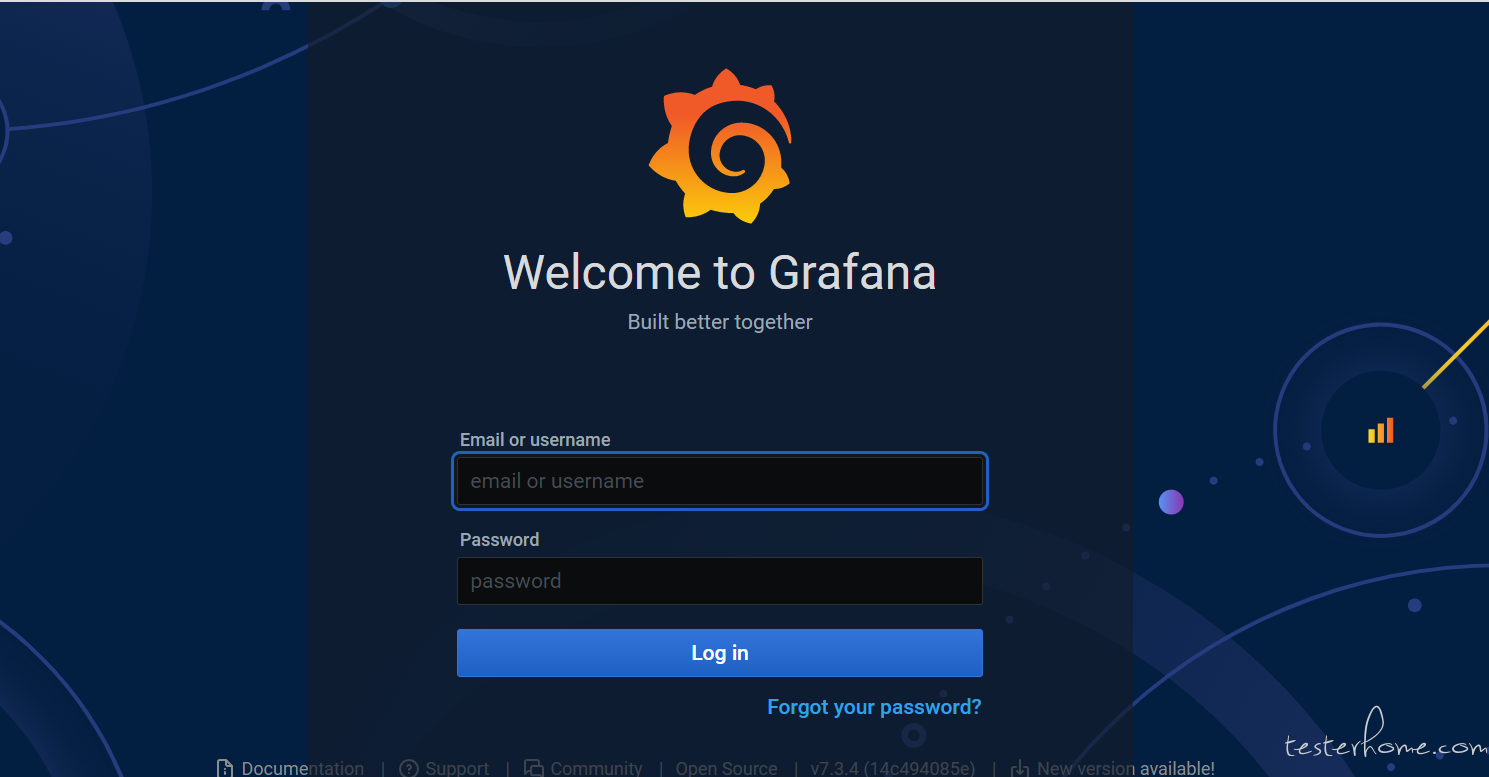
3.浏览器启动
http://ip:3000/loginadmin,用户名密码默认 admin
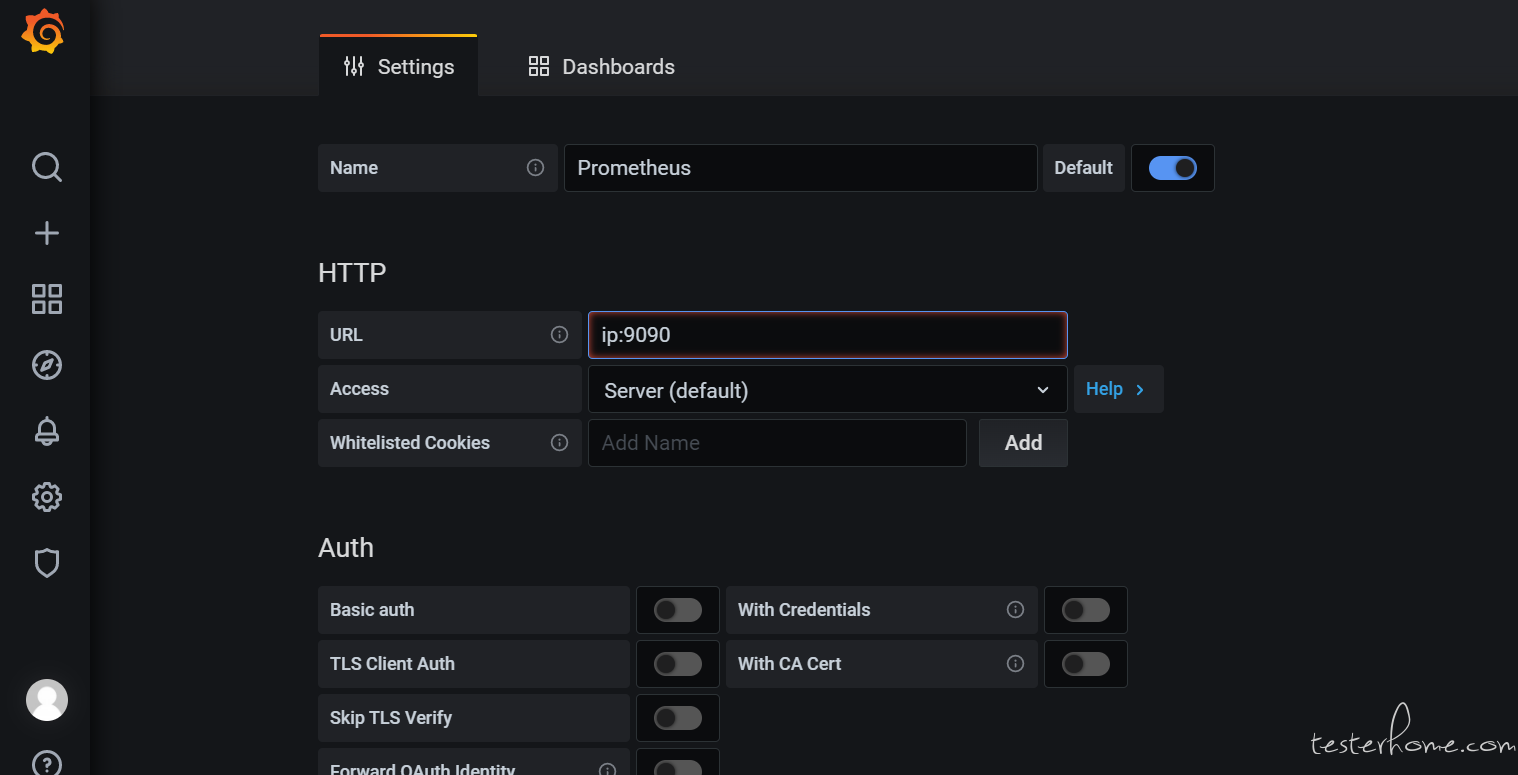
4.配置 grafana 数据源,选择 prometheus
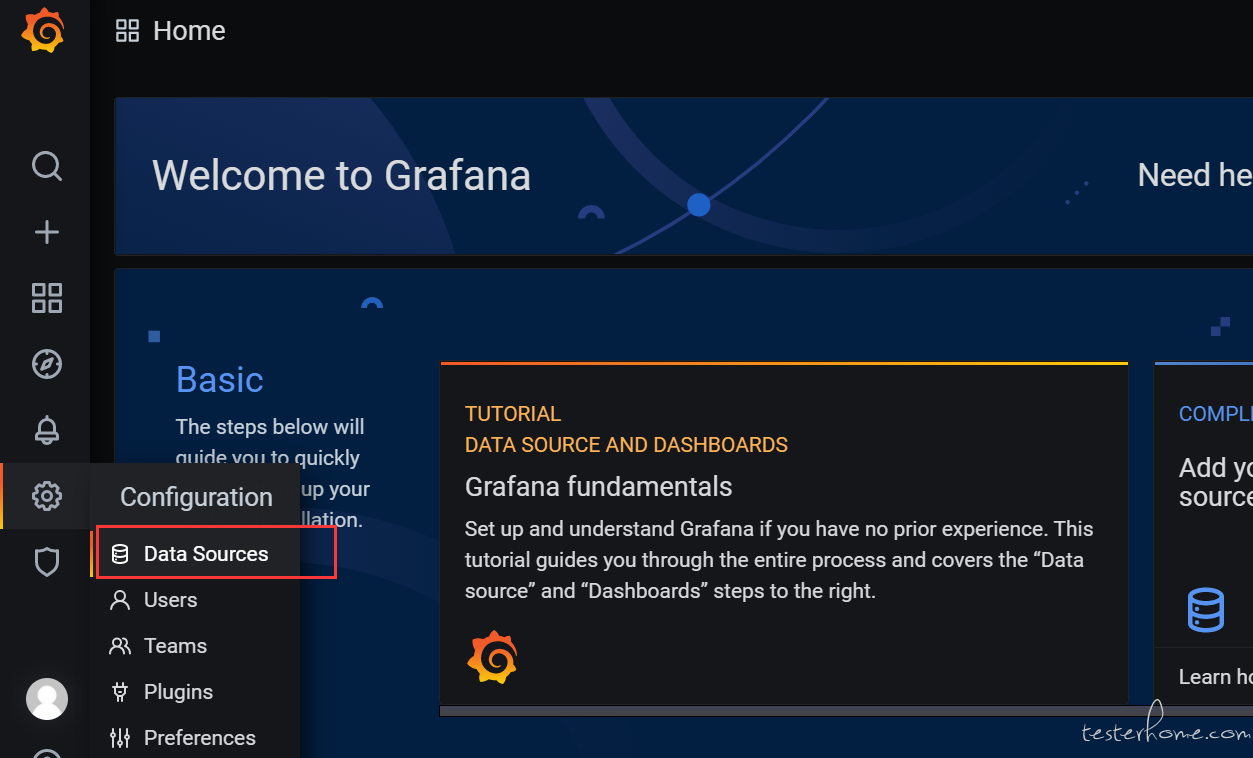
主机 ip:9090
5.仪表盘导入 prometheus 监听模板,编号 8919
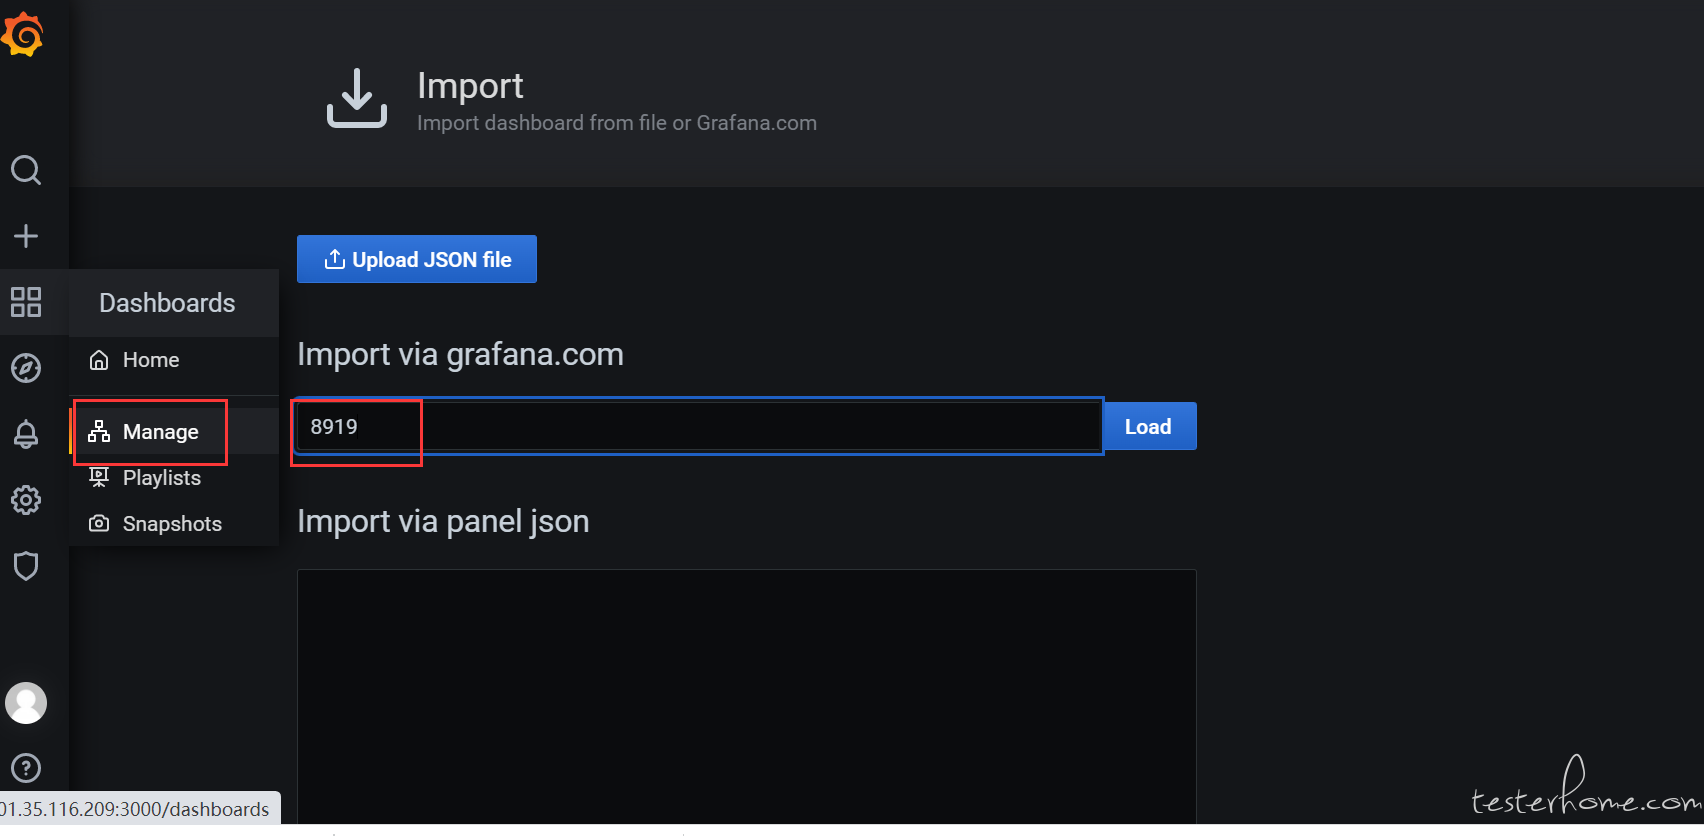
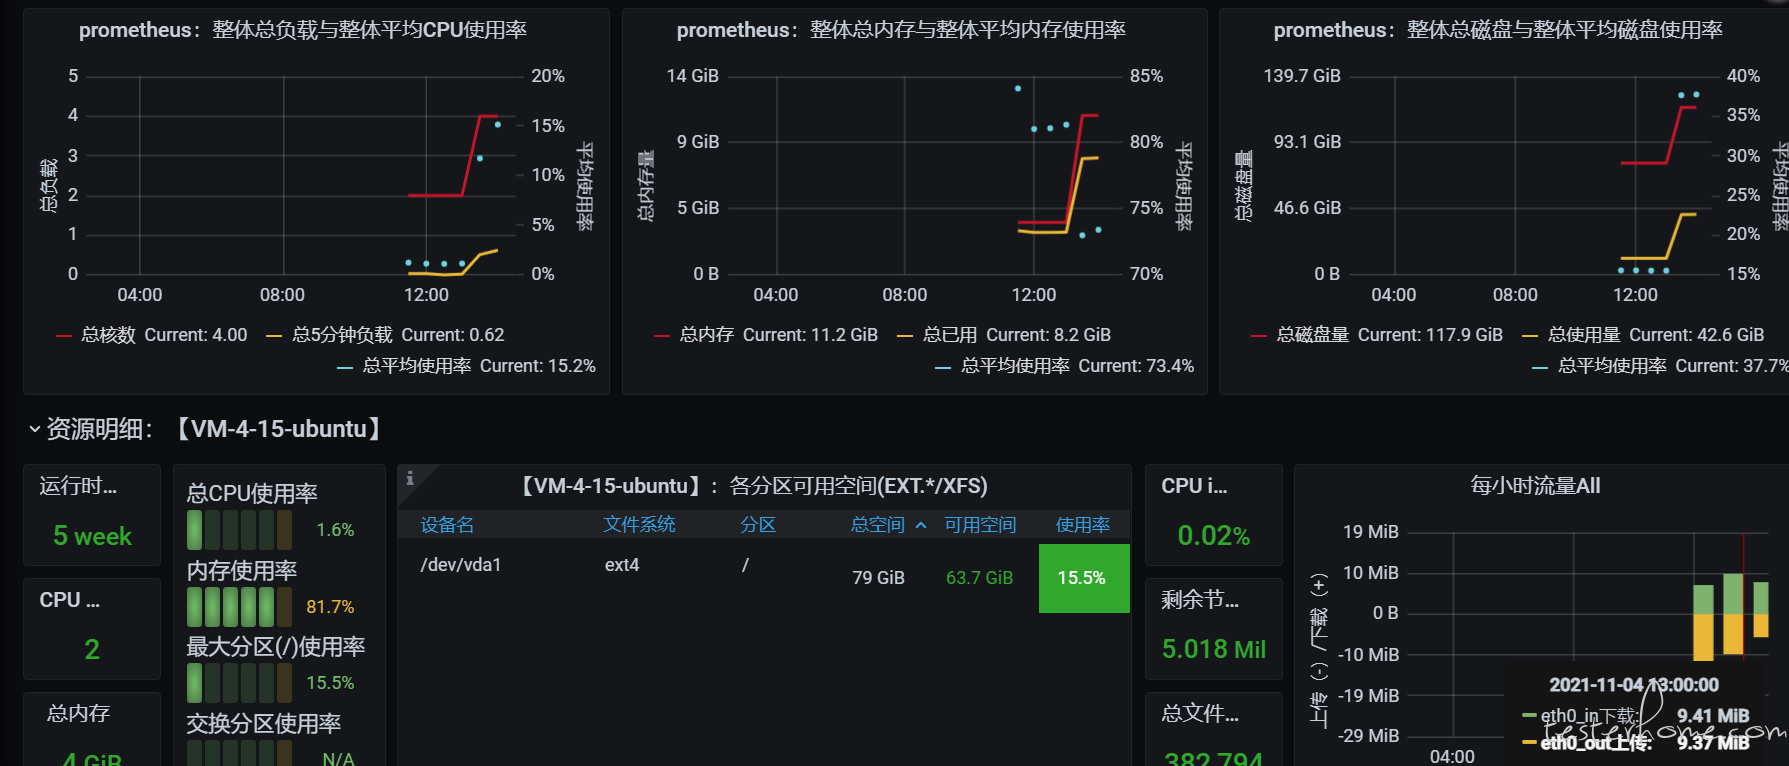
现在可以看到被监听的集群了