本文只是对自己在实际搭建过程中所遇到的问题和过程做一个简单记录。
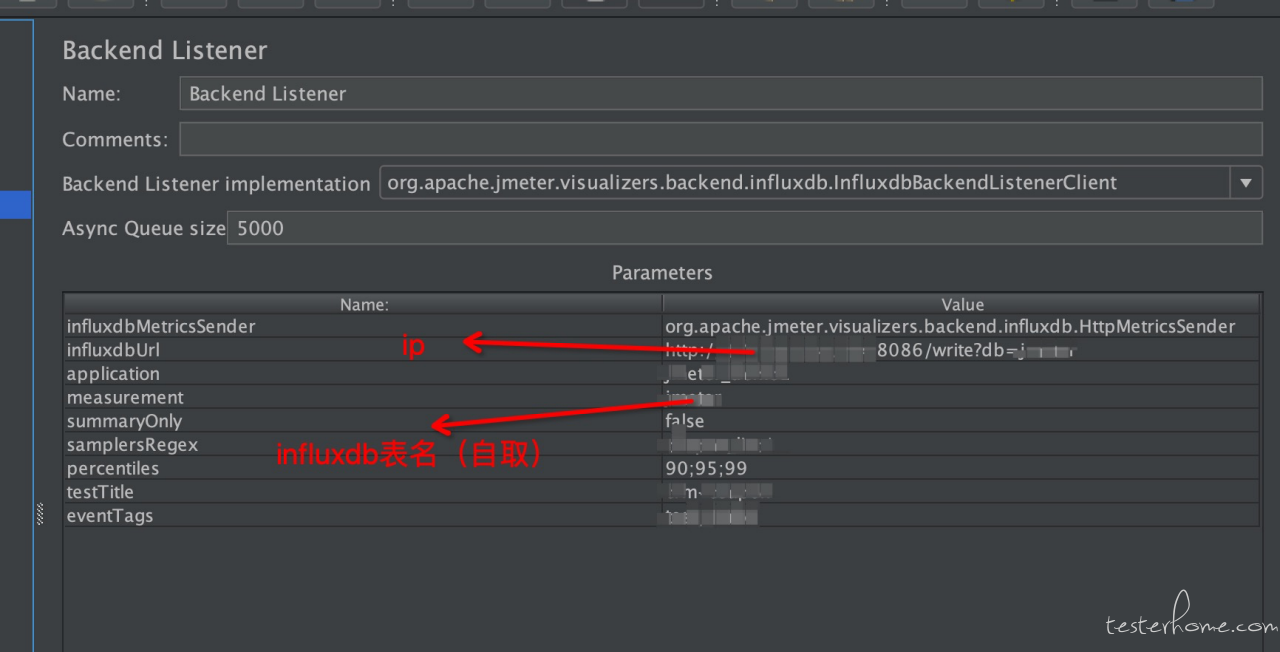

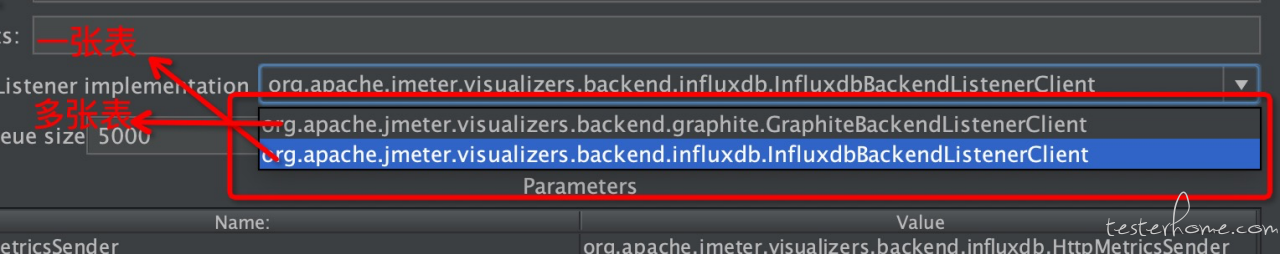
这里有两种方式:influxdb 和 Graphite,两种都可以用,区别是传递到 influxdb 的数据存储不一样
wget https://dl.influxdata.com/influxdb/releases/influxdb-1.8.0.x86_64.rpm
sudo yum localinstall influxdb-1.8.0.x86_64.rpm
Vi /etc/influxdb/influxdb.conf
[http]
 # Determines whether HTTP endpoint is enabled.
 enabled = true
 # Determines whether the Flux query endpoint is enabled.
 flux-enabled = true
 # Determines whether the Flux query logging is enabled.
 flux-log-enabled = true
 # The bind address used by the HTTP service.
 bind-address = ":8086"
 # Determines whether user authentication is enabled over HTTP/HTTPS.
 auth-enabled = true
 # The default realm sent back when issuing a basic auth challenge.
 realm = "InfluxDB"
 # Determines whether HTTP request logging is enabled.
 log-enabled = true
 # Determines whether the HTTP write request logs should be suppressed when the log is enabled.
 suppress-write-log = true
 # When HTTP request logging is enabled, this option specifies the path where
 # log entries should be written. If unspecified, the default is to write to stderr, which
 # intermingles HTTP logs with internal InfluxDB logging.
 # If influxd is unable to access the specified path, it will log an error and fall back to writing
 # the request log to stderr.
 # access-log-path = ""
 # Filters which requests should be logged. Each filter is of the pattern NNN, NNX, or NXX where N is
 # a number and X is a wildcard for any number. To filter all 5xx responses, use the string 5xx.
 # If multiple filters are used, then only one has to match. The default is to have no filters which
 # will cause every request to be printed.
 # access-log-status-filters = []
 # Determines whether detailed write logging is enabled.
 write-tracing = true
 # Determines whether the pprof endpoint is enabled.  This endpoint is used for
 # troubleshooting and monitoring.
 pprof-enabled = true
 # Enables authentication on pprof endpoints. Users will need admin permissions
 # to access the pprof endpoints when this setting is enabled. This setting has
 # no effect if either auth-enabled or pprof-enabled are set to false.
 pprof-auth-enabled = true
 # Enables a pprof endpoint that binds to localhost:6060 immediately on startup.
 # This is only needed to debug startup issues.
 # debug-pprof-enabled = false
 # Enables authentication on the /ping, /metrics, and deprecated /status
 # endpoints. This setting has no effect if auth-enabled is set to false.
  ping-auth-enabled = true
 # Determines whether HTTPS is enabled.
 https-enabled = true
[[graphite]]
 # Determines whether the graphite endpoint is enabled.
 enabled = true
 database = "jmeter"
 # retention-policy = ""
 bind-address = ":2003"
 protocol = "tcp"
 consistency-level = "one"
sudo service influxdb start
#创建数据库
create database "jmeter"
#创建用户和密码
create user  "xxx" with password 'xxx' with all privileges
#显示所有的数据库
show databases
#删除数据库
drop database "db_name"
#使用数据库
use jmeter
#显示该数据库中所有的表
show measurements
#删除表
drop measurement "measurement_name"
#下载、解压、创建软链接
wget https://github.com/prometheus/prometheus/releases/download/v2.22.0/prometheus-2.22.0.linux-amd64.tar.gz
tar -xf prometheus-2.22.0.linux-amd64.tar.gz
mv prometheus-2.22.0.linux-amd64 /usr/local/
ln -s /usr/local/prometheus-2.22.0.linux-amd64/ /usr/local/prometheus
#关闭服务:kill -TERM pid
#启动服务
systemctl start  grafana-server
systemctl status  grafana-server
systemctl enable  grafana-server
访问http://xxx:3000/admin/admin输入用户密码默认为
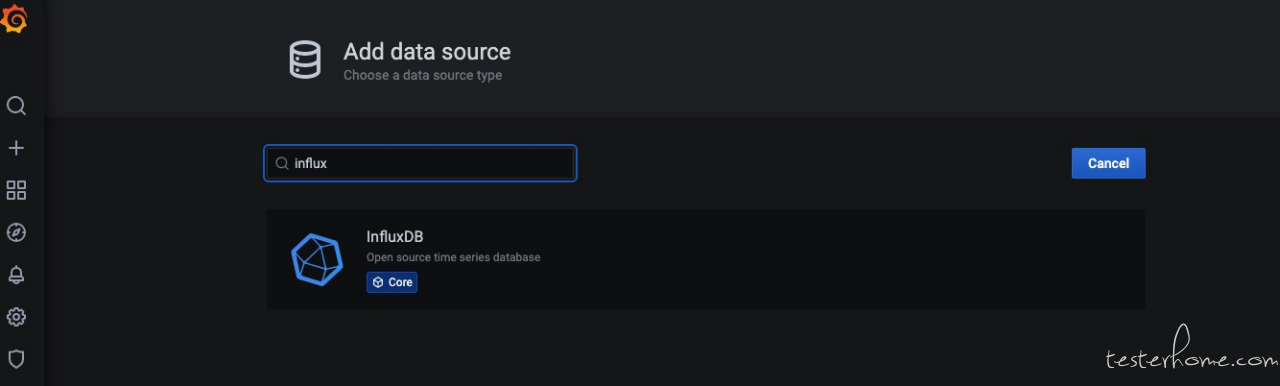
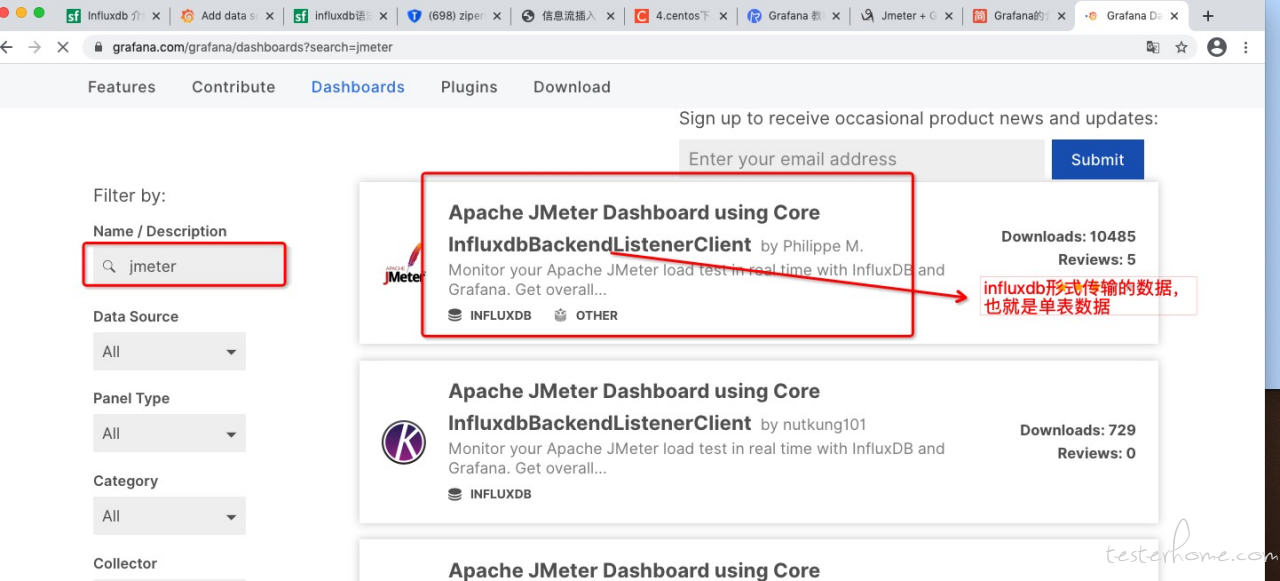
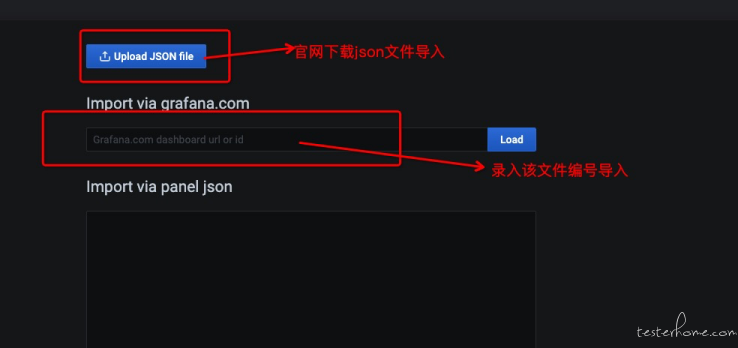
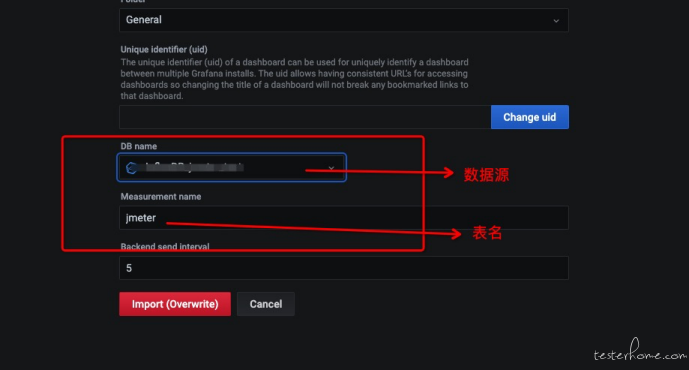
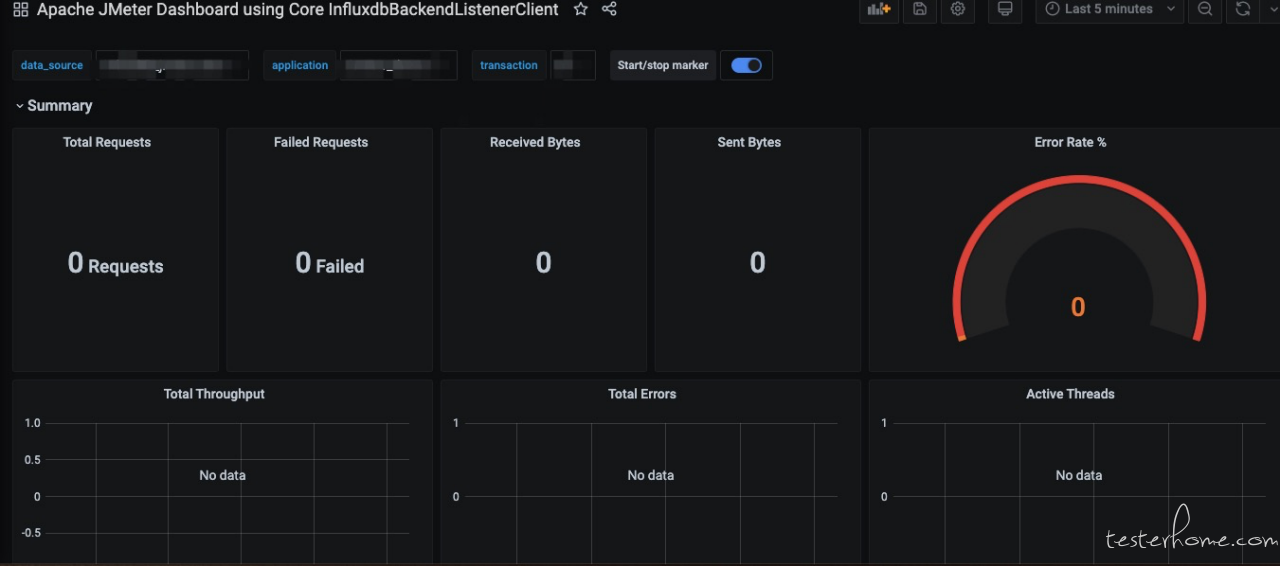
我们可以去 grafana 官网找到我们想要的看板,然后导入