
本文将尝试通过一篇文章讲清楚开源压测工具——Locust 的原理和实现过程,聚焦在实现上,不拘泥在一堆源码中(本身 Locust 的源码就比较简单)。本人并不是 Locust 铁粉,只是对它的实现方式感兴趣,所以 jmeter、wrk 的粉丝们就不要来 battle 我了。在我看来,工具都有各自的优势和缺陷,区别在于使用的人,能否选择最合适的工具达到目的,当然你可以掌握所有的主流工具,对于特定的任务,哪个简单用哪个,也可以钟情于一个工具,信手拈来,只要你能在预期时间内完成也无可厚非。
网上有很多关于 Locust 源码实现的讲解,但是我觉得都太片面了,并且没有讲清楚,恰巧 Locust 在上个月(5 月)发布了 1.x 版本,整个重构力度还是蛮大的,因此我想通过这篇文章,介绍它最新的设计以及展示最全面的 Locust 实现,让大家感受到 Locust 的简单与优雅(整个 Locust 项目不过 4M 大小)。
Locust 是开源、使用 Python 开发、基于事件、支持分布式并且提供 Web UI 进行测试执行和结果展示的性能测试工具。
Locust 的主要特性有两个:
Locust 使用了以下几个核心库:
1) gevent
    gevent是一种基于协程的Python网络库,它用到Greenlet提供的,封装了libevent事件循环的高层同步API。
2) flask
    Python编写的轻量级Web应用框架。
3) requests
    Python Http库
4) msgpack-python
    MessagePack是一种快速、紧凑的二进制序列化格式,适用于类似JSON的数据格式。msgpack-python主要提供MessagePack数据序列化及反序列化的方法。
5) pyzmq
    pyzmq是zeromq(一种通信队列)的Python实现,主要用来实现Locust的分布式模式运行
我们知道,完整的压测系统应该包含以下组件:
相比于主流的压测系统 LoadRunner 和 Jmeter,Locust 是一个更为纯粹的开源压测系统,框架本身的结构并不复杂,甚至只提供了最基础的组件,但也正因为如此,Locust 具有极高的可编程性和扩展性。对于测试开发同学来说,可以比较轻松地使用 Locust 实现对任意协议的压测。
| LoadRunner | Jmeter | Locust | |
|---|---|---|---|
| 压力生成器 | √ | √ | √ |
| 负载控制器 | √ | √ | √ |
| 系统资源监控器 | √ | x | x |
| 结果采集器 | √ | √ | √ |
| 结果分析器 | √ | √ | √ |
上表简单展示了几个工具包含的压测组件,Locust 的架构非常简单,部分组件的实现甚至都不完善,比如结果分析器,Locust 本身并没有很详细的测试报告。但这并不妨碍它成为优秀的开源框架。
Locust 最近发布了 1.x 版本,代码进行了重构,重封装,对很多类进行了重命名,本文尽量使用新名词,但涉及的旧名词不影响理解。

为了减少 CPython 的 GIL 限制,充分利用多核 CPU,建议单机启动 CPU 核数的 slave(多进程)。
上面展示的 Locust 架构,从代码层面来看究竟是如何实现的呢?下面我们就来窥视一番:

简单来说,Locust 的代码分为以下模块:
下面我们看看核心类的主要成员变量和方法

接下来我们继续了解 Locust 分布式压测的核心:Runner 的状态和通信机制。我们知道 Locust 等压测工具支持分布式压测,就是说理论上可以通过不断添加压力机 (worker) 提高并发数量,这个机制让使用者可以自由地增减机器资源,从而达到期望的施压能力。
在分布式场景下,除了数据一致性,状态同步也是非常重要的。在 Locust 的 master-slave 架构下,需要管理 master 和 slave 的状态,不仅为了控制压测的开始或停止,也是为了掌握当前的压力机情况。那么都有哪些状态?
| 状态 | 说明 |
|---|---|
| ready | 准备就绪,master 和 slave 启动后默认状态 |
| hatching | 正在孵化压力机,对 master 来说正在告诉 slave 们开始干活,对 slave 来说是过渡状态,因为它们马上要 running |
| running | 正在压测 |
| cleanup | 当发生 GreenletExit 时的状态,一般不会出现 |
| stopping | 表示正在通知 slave 们停止,只有 master 有这个状态 |
| stopped | 压测已经停止 |
| missing | 状态丢失,只有 slave 有的状态,默认 3 秒如果 master 没有收到 slave 的心跳就会认为它 missing 了,一般是进程没有正常退出导致 |
Runner 的状态不多,但是在压测过程中起到非常重要的作用,状态之间是按约定的方式进行扭转的,我们使用 Locust 的 web 界面管理 master 的状态,master 根据我们的操作通过通信机制推进 slave 的状态。

Master 与 Slave 之间是通过 Zeromq 建立的 TCP 连接进行通信的(一对多)。
ZeroMQ(简称 ZMQ)是一个基于消息队列的多线程网络库,其对套接字类型、连接处理、帧、甚至路由的底层细节进行抽象,提供跨越多种传输协议的套接字。
ZMQ 是网络通信中新的一层,介于应用层和传输层之间(按照 TCP/IP 划分),其是一个可伸缩层,可并行运行,分散在分布式系统间。
master 与各个 slave 各维持一个 TCP 连接,在每个连接中,master 下发的命令,slave 上报的信息等自由地的传输着。
class Message(object):
    def __init__(self, message_type, data, node_id):
        self.type = message_type
        self.data = data
        self.node_id = node_id

    def serialize(self):
        return msgpack.dumps((self.type, self.data, self.node_id))

    @classmethod
    def unserialize(cls, data):
        msg = cls(*msgpack.loads(data, raw=False))
        return msg
其中 message_type 指明消息类型,data 是实际的消息内容,node_id 指明机器 ID。Locust 使用msgpack做序列化与反序列化处理。
master 和 slave 之间的消息类型不过 10 种,其中大部分消息由 slave 上报给 master,下方表格可以清楚的看到,实现一套分布式系统并没有那么复杂。
| 序号 | message_type | 发送者 | data 格式 | 发送时机 |
|---|---|---|---|---|
| 1 | client_ready | slave | 空 | slave 启动后或压测停止完成 |
| 2 | hatching | slave | 空 | 接受到 master 的 hatch 先发送一个确认 |
| 3 | hatch_complete | slave | {"count":n} | 所有并发用户已经孵化完成 |
| 4 | client_stopped | slave | 空 | 停止所有并发用户后 |
| 5 | heatbeat | slave | {"state": x,"current_cpu_usage":x} | 默认每 3 秒上报一次心跳 |
| 6 | stats | slave | {"stats":[], "stats_total":{}, "errors":{},"user_count":x} | 每 3 秒上报一次压测信息 |
| 7 | exception | slave | {"msg":x, "traceback":x} | TaskSet.run 出现异常 |
| 8 | hatch | master | {"hatch_rate":x, "num_users":x, "host":x, "stop_timeout":x} | 开始 swarm |
| 9 | stop | master | 空 | 点击 stop |
| 10 | quit | master,slave | 空 | 手动或其他方式退出的时候 |
可以看到上面有一种非常重要的消息类型——stats,压测的结果采集都封装在这个消息里。
从上面我们知道有一个非常重要的消息类型——stats,这个是 slave 给 master 发送的消息,默认每 3 秒钟上报一次。stats 消息的结构如下所示:
{
    "stats": [],
    "stats_total": {},
    "errors": {},
    "user_count": 10
}
实际上,slave 也是持有着类似如上 json 格式的三个对象:
其中每一个 locust 进程会维护一个全局 RequestStats 单例 global_stats,这个实例包含一个 StatsEntry 实例 total(对应 json 的 stats_total),以及两个字典 entries(对应 json 的 stats)和 errors(对应 json 的 errors),其中 entries 字典 key 为 (name,method),对应值为一个 StatsEntry 实例,另一个 errors 字典的 key 为 (name,method,error),对应值为一个 StatsError 实例。可见,global_stats 包含了单个 slave 汇总的信息,以及各个请求 url 或 name 的统计信息。在分布式的场景下,每个 slave 都会维护一个 global_stats, 在一个上报周期达到后将信息发送到 master,发送完成后就会重置所有数据,进入下一个周期的统计。
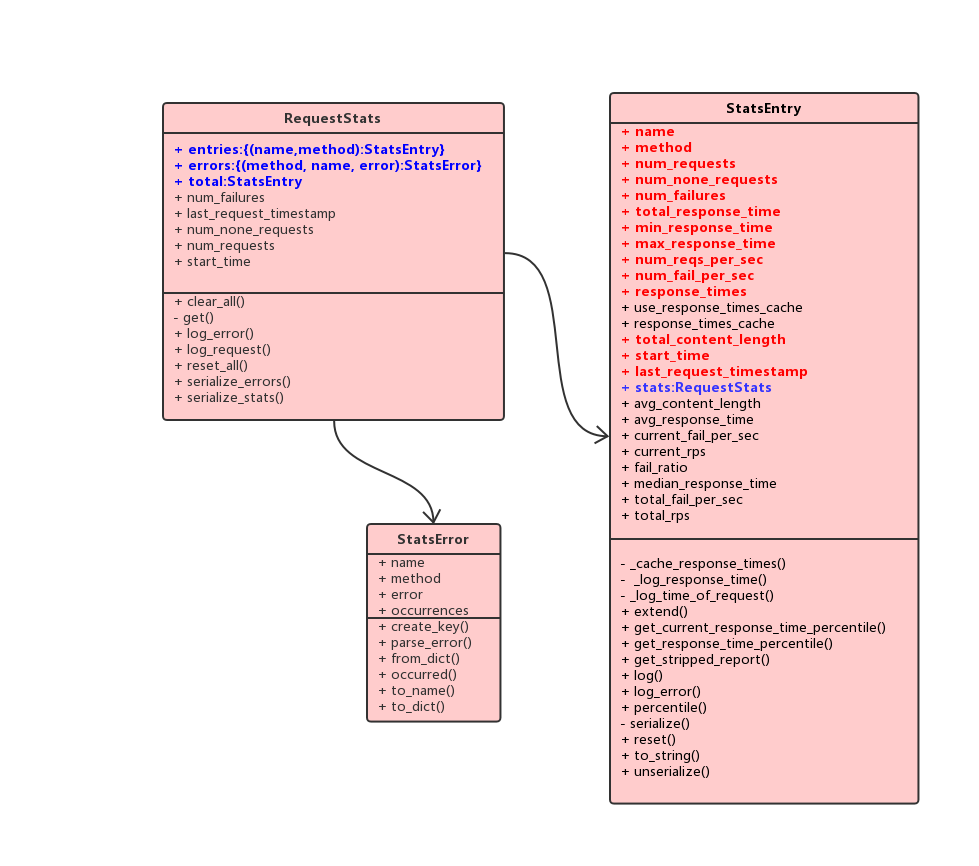
上图中红色的字段是 slave 真正上报给 master 的数据。
那么 slave 是如何统计消息,又究竟需要上报什么内容给 master?master 又是如何汇总的呢?下面我们来看看整个统计过程:
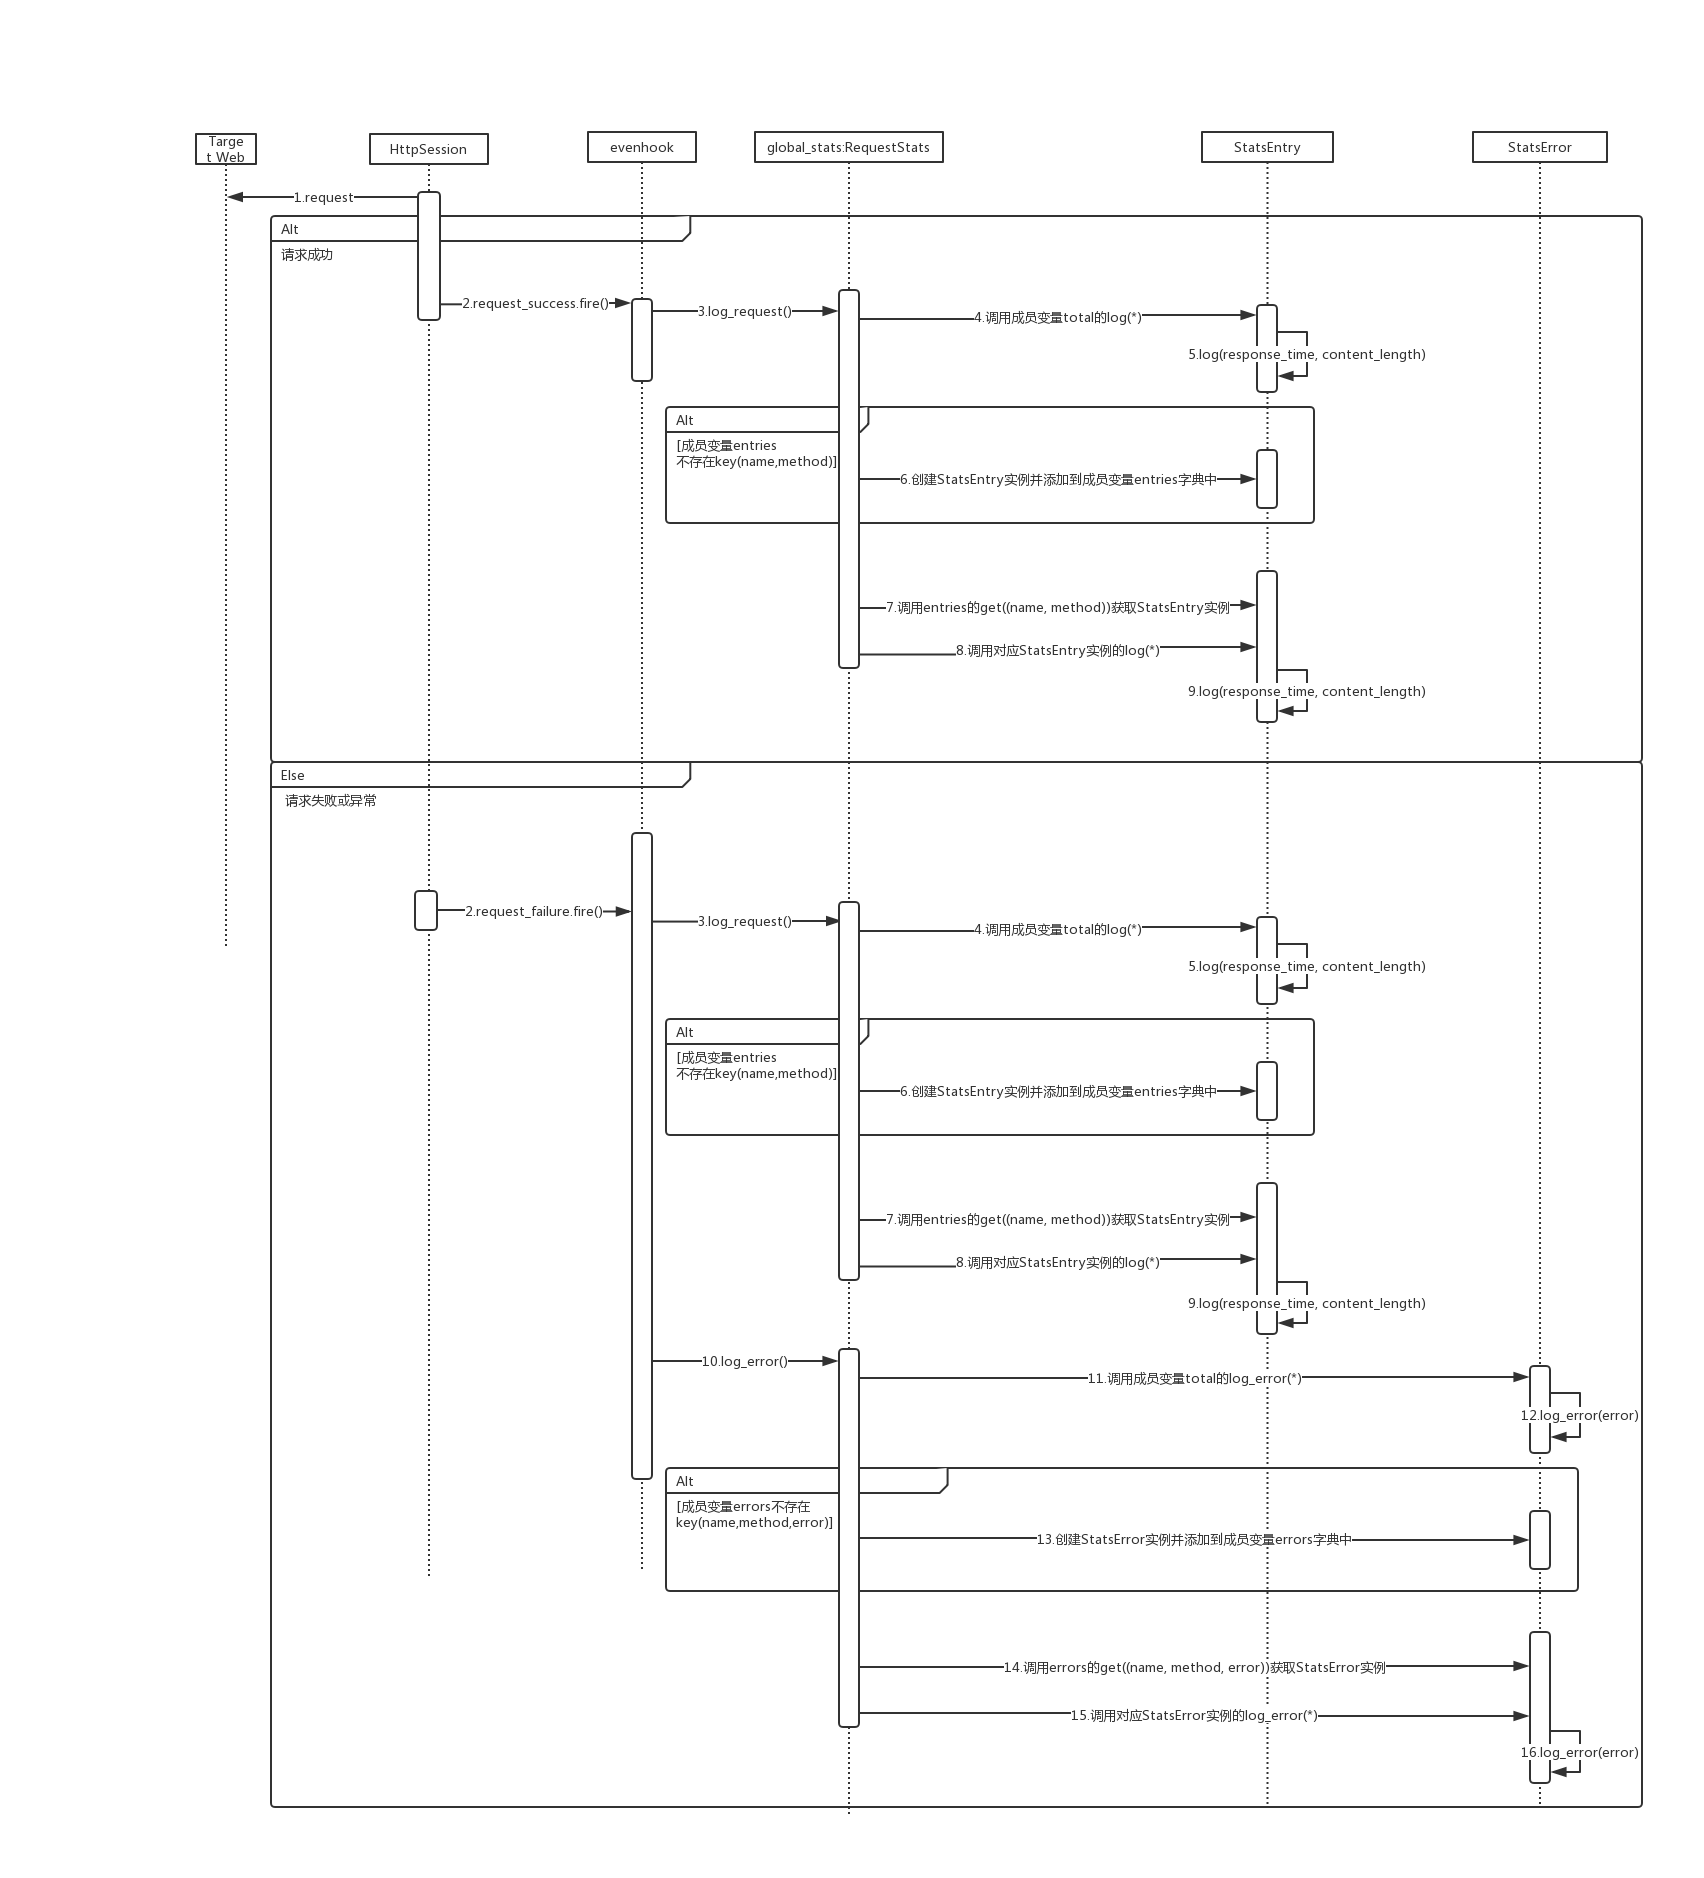
在每一次请求后,无论是成功还是失败,都会触发对应的 request_success 或者 request_failure 事件,stats.py 文件中的数据统计模块订阅了对应的事件,会调用 global_stats 对数据进行统计。
在 slave 的一个上报周期达到后,触发 on_report_to_master 事件,此时 global_stats 就会依次调用以下方法对数据进行序列化:
其实也就是对上面提到的 total 和两个字典中的内容进行序列化,其实就是转为 json 字符串。
def on_report_to_master(client_id, data):
    data["stats"] = global_stats.serialize_stats()
    data["stats_total"] = global_stats.total.get_stripped_report()
    data["errors"] =  global_stats.serialize_errors()
    global_stats.errors = {}
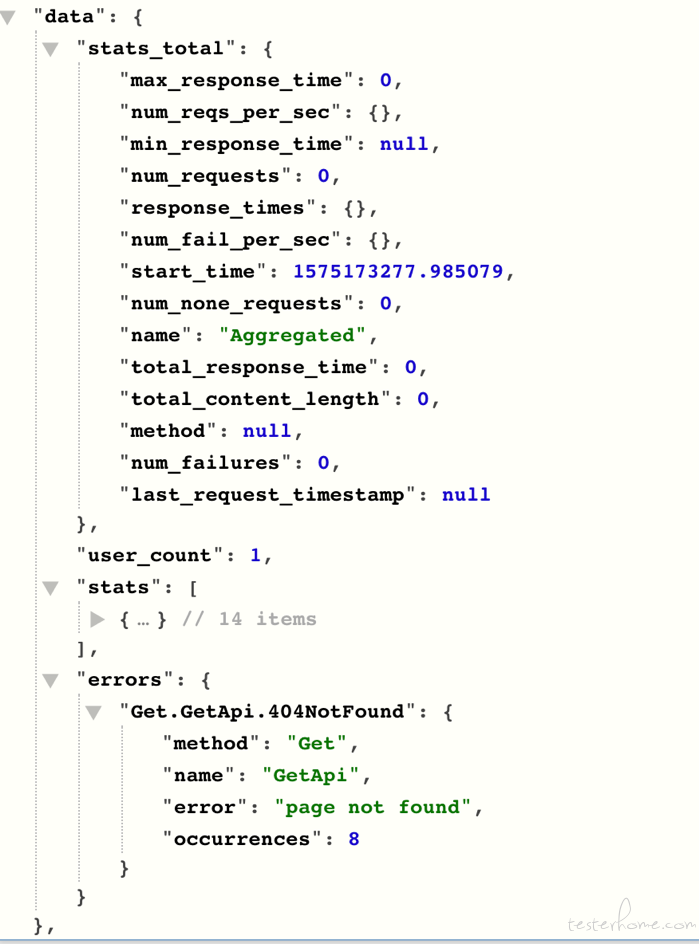
下图是断点过程看到的 stats 消息内容(在 msgpack 序列化之前):
StatsEntry 有两个比较重要的对象,分别是 num_reqs_per_sec 和 response_times,它们都是字典类型,其中 num_reqs_per_sec 的 key 是秒时间戳,显示当前秒完成了多少个请求,统计的时间是完成请求的时刻,比如如果一个请求从第 0 秒开始,第 3 秒完成,那么这个请求统计在第 3 秒的时间戳上,这个对象可以很方便的计算出 rps。response_times 的 key 是响应时间,单位是豪秒,为了防止 key 过多,做了取整,比如 147 取 150, 3432 取 3400 和 58760 取 59000,这个是为了方便获得类似 90% 请求的完成时间 (小于等于该时间),99% 请求的完成时间,下面具体的源码:
def _log_time_of_request(self, current_time):
    t = int(current_time)
    self.num_reqs_per_sec[t] = self.num_reqs_per_sec.setdefault(t, 0) + 1
    self.last_request_timestamp = current_time

def _log_response_time(self, response_time):
    if response_time is None:
        self.num_none_requests += 1
        return

    self.total_response_time += response_time

    if self.min_response_time is None:
        self.min_response_time = response_time

    self.min_response_time = min(self.min_response_time, response_time)
    self.max_response_time = max(self.max_response_time, response_time)

    # to avoid to much data that has to be transfered to the master node when
    # running in distributed mode, we save the response time rounded in a dict
    # so that 147 becomes 150, 3432 becomes 3400 and 58760 becomes 59000
    if response_time < 100:
        rounded_response_time = response_time
    elif response_time < 1000:
        rounded_response_time = int(round(response_time, -1))
    elif response_time < 10000:
        rounded_response_time = int(round(response_time, -2))
    else:
        rounded_response_time = int(round(response_time, -3))

    # increase request count for the rounded key in response time dict
    self.response_times.setdefault(rounded_response_time, 0)
    self.response_times[rounded_response_time] += 1
slave 的每一个 stats 消息到达 master 后,都会触发 master 的 slave_report 事件,master 也拥有自己的 global_stats,因此只需要将对应的信息进行累加(可以理解是所有 slave 对应内容的汇总)。具体在 StatsEntry 的 extend 方法:
def extend(self, other):
        """
        Extend the data from the current StatsEntry with the stats from another
        StatsEntry instance.
        """
        if self.last_request_timestamp is not None and other.last_request_timestamp is not None:
            self.last_request_timestamp = max(self.last_request_timestamp, other.last_request_timestamp)
        elif other.last_request_timestamp is not None:
            self.last_request_timestamp = other.last_request_timestamp
        self.start_time = min(self.start_time, other.start_time)

        self.num_requests = self.num_requests + other.num_requests
        self.num_none_requests = self.num_none_requests + other.num_none_requests
        self.num_failures = self.num_failures + other.num_failures
        self.total_response_time = self.total_response_time + other.total_response_time
        self.max_response_time = max(self.max_response_time, other.max_response_time)
        if self.min_response_time is not None and other.min_response_time is not None:
            self.min_response_time = min(self.min_response_time, other.min_response_time)
        elif other.min_response_time is not None:
            # this means self.min_response_time is None, so we can safely replace it
            self.min_response_time = other.min_response_time
        self.total_content_length = self.total_content_length + other.total_content_length

        for key in other.response_times:
            self.response_times[key] = self.response_times.get(key, 0) + other.response_times[key]
        for key in other.num_reqs_per_sec:
            self.num_reqs_per_sec[key] = self.num_reqs_per_sec.get(key, 0) + other.num_reqs_per_sec[key]
        for key in other.num_fail_per_sec:
            self.num_fail_per_sec[key] = self.num_fail_per_sec.get(key, 0) + other.num_fail_per_sec[key]
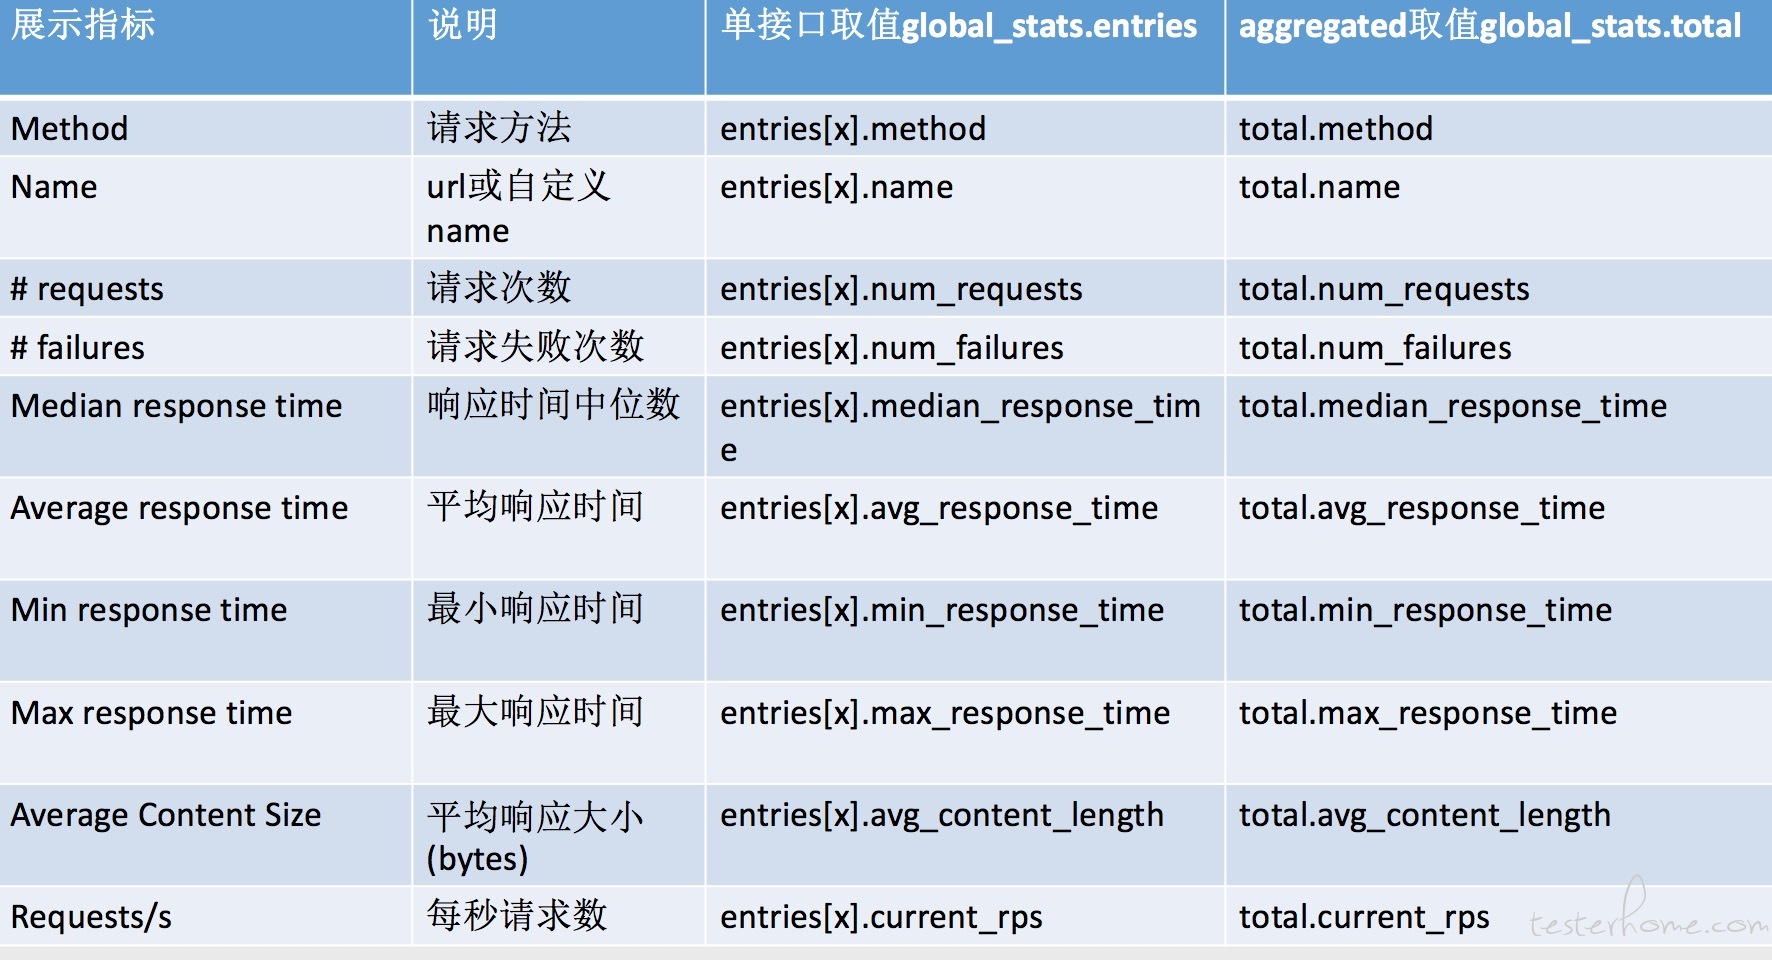
Locust 核心的指标其实就 4 个:
我们还是回到文章开头的那个 json:
{
    "stats": [],
    "stats_total": {},
    "errors": {},
    "user_count": 10
}
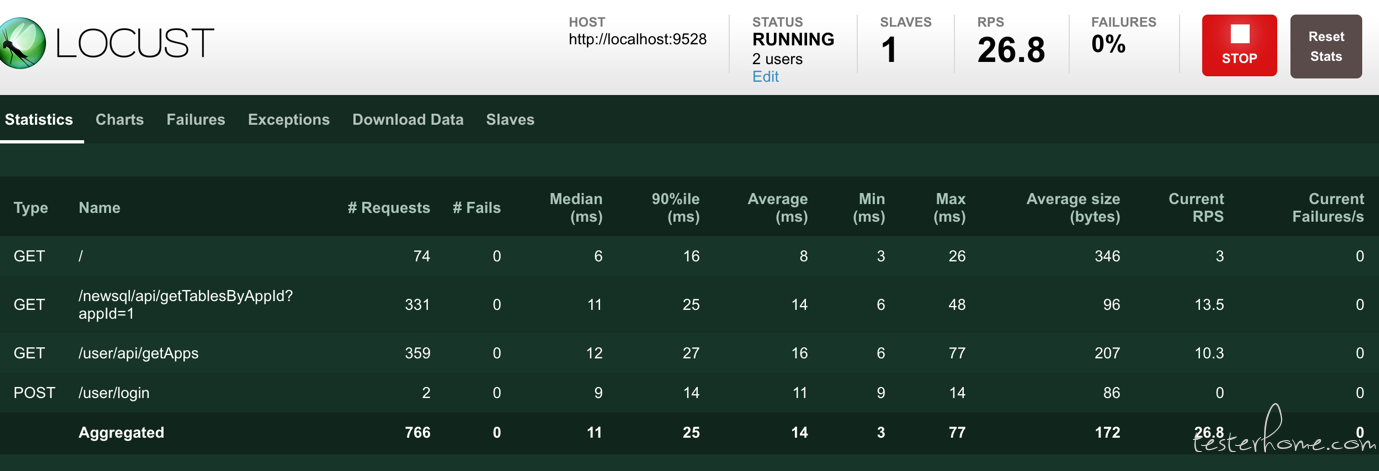
结合上方 Locust 的压测过程截图,我们可以看到,各个接口的指标其实就是 stats 对象里的各个字段,而最下方汇总的 Aggregated 这一行则对应 stats_total 的各个字段,尽管这个 json 只是 slave 单个 stats 消息的内容,却也是最终要显示的内容,只是 master 对各个消息做了汇总而已。汇总的方式也相当简单,请见上方的 StatsEntry 的 extend 方法。
因为 master 和 web 模块是一起部署的,因此 web 可以直接使用 master 的 global_stats 对象并展示其内容,可以做到动态显示。
本文讲解的 eventHook 基于 Locust 的 1.x 版本。
Locust 中的事件钩子,我认为设计得非常巧妙,所以最后再来讲一下它。event.py 模块包含了两个类,一个是事件钩子定义类 EventHook,一个是事件钩子类型类 Events,为不同的事件提供 hook。事件处理函数注册相应的 hook 以后,我们可以很方便的的基于 event 触发处理函数,实现事件驱动。
EventHook 定义了三个方法:
def add_listener(self, handler):
    self._handlers.append(handler)
    return handler

def remove_listener(self, handler):
    self._handlers.remove(handler)

def fire(self, *, reverse=False, **kwargs):
    if reverse:
        handlers = reversed(self._handlers)
    else:
        handlers = self._handlers
    for handler in handlers:
        handler(**kwargs)
可以看到 add_listener、remove_listener 的作用是注册或删除监听函数,fire 方法是触发处理函数。EventHook 的实现相比 Locust 0.x 版本有较大改变(不再使用 Python 的内置魔方方法)。
Events 中包含了 11 个事件钩子,分别是:
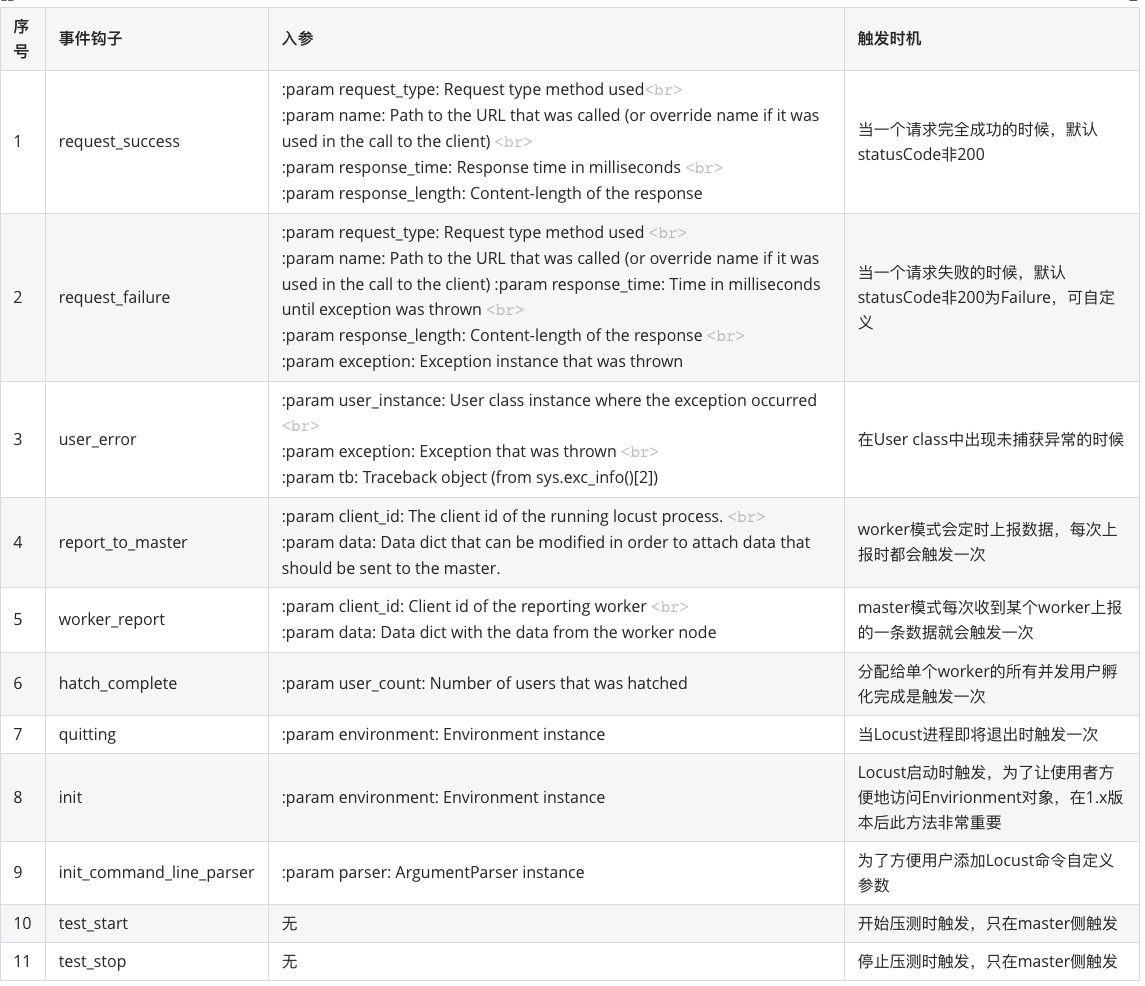
事件钩子的原理可以简单理解成,1.定义处理函数 ——> 2.注册到某个 eventHook ——> 3.在某个时机触发 eventHook ——> 4.该 eventHook 遍历执行所有处理函数。在代码层面就是定义函数,然后 add_listener,最后在想要的位置触发 eventHook 的 fire 方法并传入定义好的参数,这里参数是固定的,不能随意传入,之所以每个处理函数都能对参数进行修改,是因为这里的参数传递是『引用传递』,明白了这一点就算是掌握了 EventHook 的基本原理。
其中 Locust 本身预定义并注册了一些处理函数,比如事件钩子 report_to_master、worker_report 都有对应的处理函数,实现分布式模式下数据上报时数据的构造和计算,比如事件钩子 init,初始化 master 的 WebUI。
那么,事件钩子究竟有什么作用?
在我看来有以下作用:
举扩展性的例子,使用者可以很轻松地:
在 Locust 1.x 版本之前,使用以下方法定义和注册钩子:
def on_report_to_master(client_id, data):
    data["stats"] = global_stats.serialize_stats()
    data["stats_total"] = global_stats.total.get_stripped_report()
    data["errors"] =  global_stats.serialize_errors()
    global_stats.errors = {}

def on_slave_report(client_id, data):
    for stats_data in data["stats"]:
        entry = StatsEntry.unserialize(stats_data)
        request_key = (entry.name, entry.method)
        if not request_key in global_stats.entries:
            global_stats.entries[request_key] = StatsEntry(global_stats, entry.name, entry.method)
        global_stats.entries[request_key].extend(entry)
        ...

events.report_to_master += on_report_to_master
events.slave_report += on_slave_report
在 1.x 及之后的版本有两种使用方式:
# 方式一与之前类似
def on_report_to_master(client_id, data):
    data["stats"] = stats.serialize_stats()
    data["stats_total"] = stats.total.get_stripped_report()
    data["errors"] =  stats.serialize_errors()
    stats.errors = {}

def on_worker_report(client_id, data):
    for stats_data in data["stats"]:
        entry = StatsEntry.unserialize(stats_data)
        request_key = (entry.name, entry.method)
        if not request_key in stats.entries:
            stats.entries[request_key] = StatsEntry(stats, entry.name, entry.method, use_response_times_cache=True)
        stats.entries[request_key].extend(entry)

    for error_key, error in data["errors"].items():
        if error_key not in stats.errors:
            stats.errors[error_key] = StatsError.from_dict(error)
        else:
            stats.errors[error_key].occurrences += error["occurrences"]

    stats.total.extend(StatsEntry.unserialize(data["stats_total"]))

events.report_to_master.add_listener(on_report_to_master)
events.worker_report.add_listener(on_worker_report)

# 方式二,使用装饰器
@user2ter.add_listener
def on_report_to_master(client_id, data):
    """
    This event is triggered on the worker instances every time a stats report is
    to be sent to the locust master. It will allow us to add our extra content-length
    data to the dict that is being sent, and then we clear the local stats in the worker.
    """
    data["content-length"] = stats["content-length"]
    stats["content-length"] = 0

@events.worker_report.add_listener
def on_worker_report(client_id, data):
    """
    This event is triggered on the master instance when a new stats report arrives
    from a worker. Here we just add the content-length to the master's aggregated
    stats dict.
    """
    stats["content-length"] += data["content-length"]
第二种方式更加简洁,不容易忘记注册处理函数。
首先需要声明的是,本人并不是性能测试方向的专家,只是做过一些性能测试,捣鼓过一些工具,之所以写出这篇文章,初衷只是为了在组内分享。了解 Locust 的人,很少会真的用他来进行大型业务场景压测,一是它的压测性能受限,二是它没有很好的测试报告,现在这些在我看来已经不是问题,我想在后面分两篇文章介绍,敬请期待:
一、如何提高 Locust 的压测性能——boomer
二、重新定义 Locust 的测试报告
