开源测试工具 Jmeter 的性能监控框架搭建记录 (Grafana+Influxdb+Telegraf)
一 使用目的
Jmeter
Grafana
Influxdb
Telegraf
利用以上开源性能监控工具,可以达到以下两大方面的监控:
1 负载施压负载情况监控 (请求数 tps qps 响应时间等)
2 被压测机器的硬件资源消耗 (cpu,内存,网络,磁盘 IO 等)
二 参考内容
http://docs.grafana.org/
https://docs.influxdata.com/influxdb/v1.6/
https://docs.influxdata.com/telegraf/v1.7/
三 安装帮助
提供两种安装方式,看个人偏好按需选择。有 *** 条件的和希望维护更新简便的建议 apt 添加源的方式。
独立下载 deb 包的方式,有利于对包的版本做限制,自己根据实际需要更新的情况手动更新维护。
以下均为在 ubuntu16.04.4 或 ubuntu18.04.1 桌面版上安装部署记录.
Influxdb 安装
方法一:deb 包安装
Ubuntu & Debian
https://portal.influxdata.com/downloads
wget https://dl.influxdata.com/influxdb/releases/influxdb_1.6.0_amd64.deb
sudo dpkg -i influxdb_1.6.0_amd64.deb
方法二:apt 源
Installation of InfluxDB on Ubuntu 18.04 is done from Influxdata repository. Once the repo is added, the package can then be installed using an apt package manager. Add the InfluxData repository to the file /etc/apt/sources.list.d/influxdb.list
$ sudo gedit  /etc/apt/sources.list.d/influxdb.list
 追加
deb https://repos.influxdata.com/ubuntu bionic stable
Import apt key:
$ sudo curl -sL https://repos.influxdata.com/influxdb.key | sudo apt-key add -

Update apt index and install influxdb
$ sudo apt-get update

$ sudo apt-get install influxdb
正在读取软件包列表... 完成
正在分析软件包的依赖关系树
正在读取状态信息... 完成
下列【新】软件包将被安装:
  influxdb
升级了 0 个软件包,新安装了 1 个软件包,要卸载 0 个软件包,有 0 个软件包未被升级。
需要下载 23.0 MB 的归档。
解压缩后会消耗 76.5 MB 的额外空间。
获取:1 https://repos.influxdata.com/ubuntu bionic/stable amd64 influxdb amd64 1.6.0-1 [23.0 MB]
已下载 23.0 MB,耗时 7秒 (3,445 kB/s)
正在选中未选择的软件包 influxdb。
(正在读取数据库 ... 系统当前共安装有 454581 个文件和目录。)
正准备解包 .../influxdb_1.6.0-1_amd64.deb  ...
正在解包 influxdb (1.6.0-1) ...
正在设置 influxdb (1.6.0-1) ...
Created symlink /etc/systemd/system/influxd.service → /lib/systemd/system/influxdb.service.
Created symlink /etc/systemd/system/multi-user.target.wants/influxdb.service → /lib/systemd/system/influxdb.service.
正在处理用于 man-db (2.8.3-2) 的触发器 ...


Start and enable the service to start on boot up. 添加随开机自启动服务
$ sudo systemctl start influxdb

$ sudo  systemctl enable influxdb

  检查是否添加自启动成功
$ sudo systemctl is-enabled influxdb


Check service status
$ systemctl status influxdb
● influxdb.service - InfluxDB is an open-source, distributed, time series database
   Loaded: loaded (/lib/systemd/system/influxdb.service; enabled; vendor preset: enabled)
   Active: active (running) since Wed 2018-07-11 17:20:11 CST; 6s ago
     Docs: https://docs.influxdata.com/influxdb/
 Main PID: 9774 (influxd)
    Tasks: 14 (limit: 4915)
   CGroup: /system.slice/influxdb.service
           └─9774 /usr/bin/influxd -config /etc/influxdb/influxdb.conf
7月 11 17:20:12 TR influxd[9774]: ts=2018-07-11T09:20:12.221964Z lvl=info msg="Starting precreation
7月 11 17:20:12 TR influxd[9774]: ts=2018-07-11T09:20:12.221989Z lvl=info msg="Starting snapshot ser
7月 11 17:20:12 TR influxd[9774]: ts=2018-07-11T09:20:12.222005Z lvl=info msg="Starting continuous q
7月 11 17:20:12 TR influxd[9774]: ts=2018-07-11T09:20:12.222021Z lvl=info msg="Starting HTTP service
7月 11 17:20:12 TR influxd[9774]: ts=2018-07-11T09:20:12.222036Z lvl=info msg="opened HTTP access lo
7月 11 17:20:12 TR influxd[9774]: ts=2018-07-11T09:20:12.222218Z lvl=info msg="Listening on HTTP" lo
7月 11 17:20:12 TR influxd[9774]: ts=2018-07-11T09:20:12.222258Z lvl=info msg="Starting retention po
7月 11 17:20:12 TR influxd[9774]: ts=2018-07-11T09:20:12.222852Z lvl=info msg="Listening for signals
7月 11 17:20:12 TR influxd[9774]: ts=2018-07-11T09:20:12.261043Z lvl=info msg="Sending usage statist
7月 11 17:20:12 TR influxd[9774]: ts=2018-07-11T09:20:12.260262Z lvl=info msg="Storing statistics" l
备份和配置 influxdb.conf
$ sudo systemctl stop influxdb

$ sudo cp /etc/influxdb/influxdb.conf /etc/influxdb/influxdb.conf.backup

  大致修改的内容如下
$ sudo gedit /etc/influxdb/influxdb.conf

[http]
  # Determines whether HTTP endpoint is enabled.
    enabled = true

  # The bind address used by the HTTP service.
    bind-address = ":8086"


[[graphite]]
  # Determines whether the graphite endpoint is enabled.
    enabled = true
    database = "jmeter"
    retention-policy = ""
    bind-address = ":2003"
    protocol = "tcp"
    consistency-level = "one"
启动influxd:
$ sudo  influxd   -config /etc/influxdb/influxdb.conf
或
 $ sudo systemctl start influxdb
先创建 influxdb 数据库 jmeter
cmd@TR:~$ influx
Connected to http://localhost:8086 version 1.6.0
InfluxDB shell version: 1.6.0

> CREATE DATABASE jmeter

> SHOW DATABASES
name: databases
name
----
telegraf
_internal
jmeter
> use jmeter
Using database jmeter
遇到问题:
cmd@TR:~$ curl http://localhost:8083
curl: (7) Failed to connect to localhost port 8083: 拒绝连接


cmd@TR:~$ curl http://localhost:8086
404 page not found


cmd@TR:~$ sudo ufw allow 8086/tcp
[sudo] cmd 的密码:
防火墙规则已更新
规则已更新(v6)


cmd@TR:~$ sudo ufw allow 8083/tcp
防火墙规则已更新
规则已更新(v6)

修改防火墙后,curl 问题依旧


cmd@TR:~$ sudo ufw disable
防火墙在系统启动时自动禁用
重启系统, 启动 sudo systemctl start influxdb curl 问题依旧
后续用 Grafana 配置添加 DataSources 到是连通 jmeter 数据库正常。暂时不管该问题。
后来发现,原来,官方 1.2 以上都移除了 admin web 管理页面监控,当然访问失败。不用管这个 url 了.
用下边命令来检查 influxd 必要启动的相关服务端口 8086 8088 2003 等,具体用途详见官方说明
cmd@TR:~$ sudo netstat -tlnpu |grep influxd
tcp        0      0 127.0.0.1:8088          0.0.0.0:*               LISTEN      17275/influxd
tcp6       0      0 :::2003                 :::*                    LISTEN      17275/influxd
tcp6       0      0 :::8086                 :::*                    LISTEN      17275/influxd
Grafana 安装
http://docs.grafana.org/installation/debian/
方法一:deb 包安装
wget https://s3-us-west-2.amazonaws.com/grafana-releases/release/grafana_5.1.4_amd64.deb
sudo apt-get install -y adduser libfontconfig
sudo dpkg -i grafana_5.1.4_amd64.deb
Open Port on Firewall
Grafana default http port is 3000, you’ll need to allow access to this port on the firewall. Ubuntu comes with ufw firewall. For Debian, you can install it using:
$ sudo apt-get install ufw

Then enable the firewall service:
$ sudo ufw enable

Open the port on the firewall:
$ sudo ufw allow 3000/tcp
Rule added
Rule added (v6)

To allow access only from a specific subnet, use:
$ sudo ufw allow from 192.168.50.0/24 to any port 3000
Accessing Grafana Dashboard
Access Grafana Dashboard using the server IP address or hostname and port 3000.

Default logins are:
Username: admin
Password: admin
方法二:apt 源
Installing Grafana on Ubuntu 18.04 / Debian 9 using APT repository
Add the following line to /etc/apt/sources.list.d/grafana.list
$ cat /etc/apt/sources.list.d/grafana.list
deb https://packagecloud.io/grafana/stable/debian/ stretch main

Then add the Package Cloud key. This allows you to install signed packages.
$ sudo curl https://packagecloud.io/gpg.key | sudo apt-key add -

Update apt index and install grafana
$ sudo apt-get update

Run the command below to install Grafana on Ubuntu 18.04:
$ sudo apt-get install grafana --fix-missing
正在读取软件包列表... 完成
正在分析软件包的依赖关系树
正在读取状态信息... 完成
下列【新】软件包将被安装:
 grafana
升级了 0 个软件包,新安装了 1 个软件包,要卸载 0 个软件包,有 0 个软件包未被升级。
需要下载 54.5 MB 的归档。
解压缩后会消耗 166 MB 的额外空间。
获取:1 https://packagecloud.io/grafana/stable/debian stretch/main amd64 grafana amd64 5.2.1 [54.5 MB]
已下载 54.5 MB,耗时 24秒 (2,256 kB/s)
正在选中未选择的软件包 grafana。
(正在读取数据库 ... 系统当前共安装有 454607 个文件和目录。)
正准备解包 .../grafana_5.2.1_amd64.deb  ...
正在解包 grafana (5.2.1) ...
正在处理用于 ureadahead (0.100.0-20) 的触发器 ...
正在处理用于 systemd (237-3ubuntu10) 的触发器 ...
正在设置 grafana (5.2.1) ...
正在添加系统用户"grafana" (UID 123)...
正在将新用户"grafana" (UID 123)添加到组"grafana"...
无法创建主目录"/usr/share/grafana"
### NOT starting on installation, please execute the following statements to configure grafana to start automatically using systemd
sudo /bin/systemctl daemon-reload
sudo /bin/systemctl enable grafana-server
### You can start grafana-server by executing
sudo /bin/systemctl start grafana-server
正在处理用于 ureadahead (0.100.0-20) 的触发器 ...
正在处理用于 systemd (237-3ubuntu10) 的触发器 ...


Start and enable grafana-server service to start on boot:
$ sudo systemctl start grafana-server
Enable it to start on boot:
$ sudo /bin/systemctl daemon-reload
$ sudo /bin/systemctl enable grafana-server
Synchronizing state of grafana-server.service with SysV service script with /lib/systemd/systemd-sysv-install.
Executing: /lib/systemd/systemd-sysv-install enable grafana-server
Created symlink /etc/systemd/system/multi-user.target.wants/grafana-server.service → /usr/lib/systemd/system/grafana-server.service.


Check status to confirm that it is running:
$ sudo systemctl status grafana-server
● grafana-server.service - Grafana instance
  Loaded: loaded (/usr/lib/systemd/system/grafana-server.service; enabled; vendor preset: enabled)
  Active: active (running) since Wed 2018-07-11 17:22:27 CST; 14s ago
    Docs: http://docs.grafana.org
Main PID: 10889 (grafana-server)
   Tasks: 13 (limit: 4915)
  CGroup: /system.slice/grafana-server.service
          └─10889 /usr/sbin/grafana-server --config=/etc/grafana/grafana.ini --pidfile=/var/run/gra
7月 11 17:22:41 TR grafana-server[10889]: t=2018-07-11T17:22:41+0800 lvl=info msg="Executing migrati
7月 11 17:22:41 TR grafana-server[10889]: t=2018-07-11T17:22:41+0800 lvl=info msg="Executing migrati
7月 11 17:22:41 TR grafana-server[10889]: t=2018-07-11T17:22:41+0800 lvl=info msg="Executing migrati
7月 11 17:22:41 TR grafana-server[10889]: t=2018-07-11T17:22:41+0800 lvl=info msg="Executing migrati
7月 11 17:22:41 TR grafana-server[10889]: t=2018-07-11T17:22:41+0800 lvl=info msg="Executing migrati
7月 11 17:22:41 TR grafana-server[10889]: t=2018-07-11T17:22:41+0800 lvl=info msg="Executing migrati
7月 11 17:22:41 TR grafana-server[10889]: t=2018-07-11T17:22:41+0800 lvl=info msg="Executing migrati
7月 11 17:22:42 TR grafana-server[10889]: t=2018-07-11T17:22:42+0800 lvl=info msg="Executing migrati
7月 11 17:22:42 TR grafana-server[10889]: t=2018-07-11T17:22:42+0800 lvl=info msg="Executing migrati
7月 11 17:22:42 TR grafana-server[10889]: t=2018-07-11T17:22:42+0800 lvl=info msg="Executing migrati
lines 1-19/19 (END)
启动服务成功后,grafana 默认访问地址
http://localhost:3000
Telegraf 安装
方法一:deb 包安装
Ubuntu & Debian
wget https://dl.influxdata.com/telegraf/releases/telegraf_1.7.1-1_amd64.deb
sudo dpkg -i telegraf_1.7.1-1_amd64.deb
方法二:apt 源
Installation of telegraf on Ubuntu 18.04 is done from Influxdata repository. Once the repo is added, the package can then be installed using an apt package manager. Add the InfluxData repository to the file  /etc/apt/sources.list.d/influxdata.list
$ cat /etc/apt/sources.list.d/influxdata.list
deb https://repos.influxdata.com/ubuntu bionic stable

Import apt key:
$ sudo curl -sL https://repos.influxdata.com/influxdb.key | sudo apt-key add -

Update apt index and install telegraf
$ sudo apt-get update

Install telegraf:
$ sudo apt-get install telegraf
正在读取软件包列表... 完成
正在分析软件包的依赖关系树
正在读取状态信息... 完成
下列【新】软件包将被安装:
 telegraf
升级了 0 个软件包,新安装了 1 个软件包,要卸载 0 个软件包,有 0 个软件包未被升级。
需要下载 10.3 MB 的归档。
解压缩后会消耗 30.5 MB 的额外空间。
获取:1 https://repos.influxdata.com/ubuntu bionic/stable amd64 telegraf amd64 1.7.1-1 [10.3 MB]
已下载 10.3 MB,耗时 3秒 (3,140 kB/s)
正在选中未选择的软件包 telegraf。
(正在读取数据库 ... 系统当前共安装有 455988 个文件和目录。)
正准备解包 .../telegraf_1.7.1-1_amd64.deb  ...
正在解包 telegraf (1.7.1-1) ...
正在设置 telegraf (1.7.1-1) ...
Created symlink /etc/systemd/system/multi-user.target.wants/telegraf.service → /lib/systemd/system/telegraf.service.

Start and enable the service to start on boot up.
$ sudo systemctl start telegraf
$ sudo  systemctl enable telegraf
$ sudo systemctl is-enabled telegraf

Check service status:
~$ sudo systemctl status telegraf
● telegraf.service - The plugin-driven server agent for reporting metrics into InfluxDB
  Loaded: loaded (/lib/systemd/system/telegraf.service; enabled; vendor preset: enabled)
  Active: active (running) since Wed 2018-07-11 17:25:06 CST; 10s ago
    Docs: https://github.com/influxdata/telegraf
Main PID: 12161 (telegraf)
   Tasks: 20 (limit: 4915)
  CGroup: /system.slice/telegraf.service
          └─12161 /usr/bin/telegraf -config /etc/telegraf/telegraf.conf -config-directory /etc/telegraf/telegraf.d
7月 11 17:25:06 TR systemd[1]: Started The plugin-driven server agent for reporting metrics into InfluxDB.
7月 11 17:25:06 TR telegraf[12161]: 2018-07-11T09:25:06Z I! Starting Telegraf v1.7.1
7月 11 17:25:06 TR telegraf[12161]: 2018-07-11T09:25:06Z I! Loaded inputs: inputs.kernel inputs.mem inputs.processes inputs.swap inputs
7月 11 17:25:06 TR telegraf[12161]: 2018-07-11T09:25:06Z I! Loaded aggregators:
7月 11 17:25:06 TR telegraf[12161]: 2018-07-11T09:25:06Z I! Loaded processors:
7月 11 17:25:06 TR telegraf[12161]: 2018-07-11T09:25:06Z I! Loaded outputs: influxdb
7月 11 17:25:06 TR telegraf[12161]: 2018-07-11T09:25:06Z I! Tags enabled: host=TR
7月 11 17:25:06 TR telegraf[12161]: 2018-07-11T09:25:06Z I! Agent Config: Interval:10s, Quiet:false, Hostname:"TR", Flush Interval:10s
lines 1-17/17 (END)
备份和修改 telegraf.conf
$ sudo cp /etc/telegraf/telegraf.conf /etc/telegraf/telegraf.conf.backup

$ sudo gedit /etc/telegraf/telegraf.conf
# Configuration for sending metrics to InfluxDB
[[outputs.influxdb]]
 ## The full HTTP or UDP URL for your InfluxDB instance.
 ##
 ## Multiple URLs can be specified for a single cluster, only ONE of the
 ## urls will be written to each interval.
 # urls = ["unix:///var/run/influxdb.sock"]
 # urls = ["udp://127.0.0.1:8089"]
 # 你安装的Influxdb地址  我安装在了本机配置可以是127.0.0.1 或 localhost 或你本机配置的固定ip 接:8086
   urls = ["http://192.168.***.***:8086"]

 ## The target database for metrics; will be created as needed.
 #  你想要监控host硬件资源机器的存储数据库名 ,比如要监控固定ip机器69.113 便可起名IP_66_113
   database = "IP_66_113"
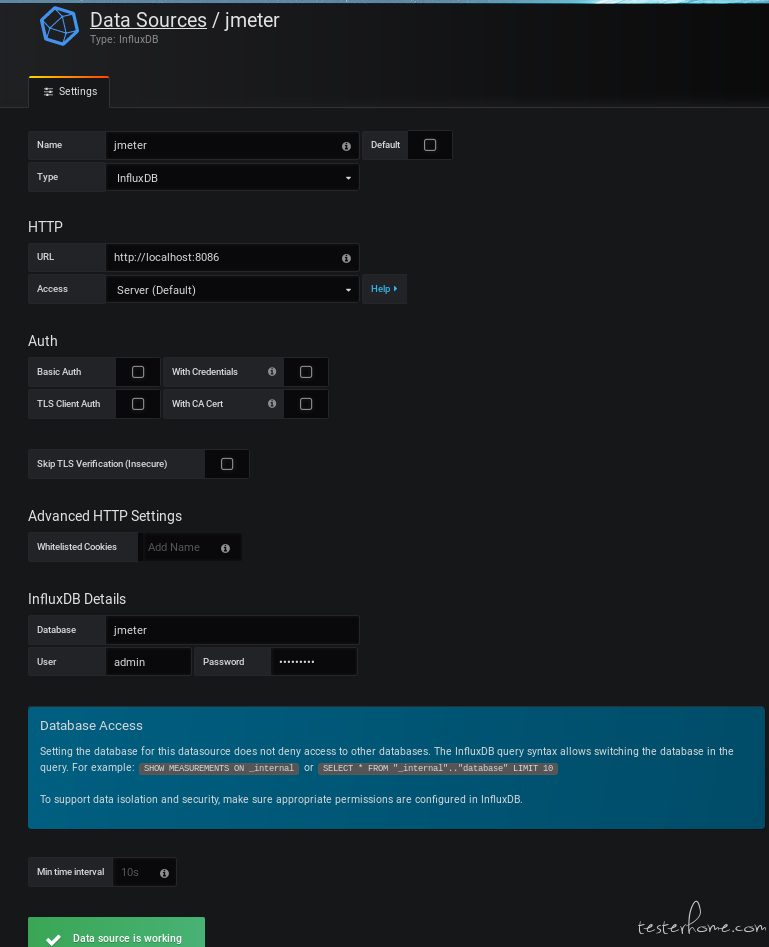
访问 grafana
最后 打开以上三个服务后,访问 grafana http://localhost:3000
添加数据源类型 influxdb 的 jmeter 数据库, 也就是 influxdb.conf 中配置的为了记录 jmeter 负载情况的。
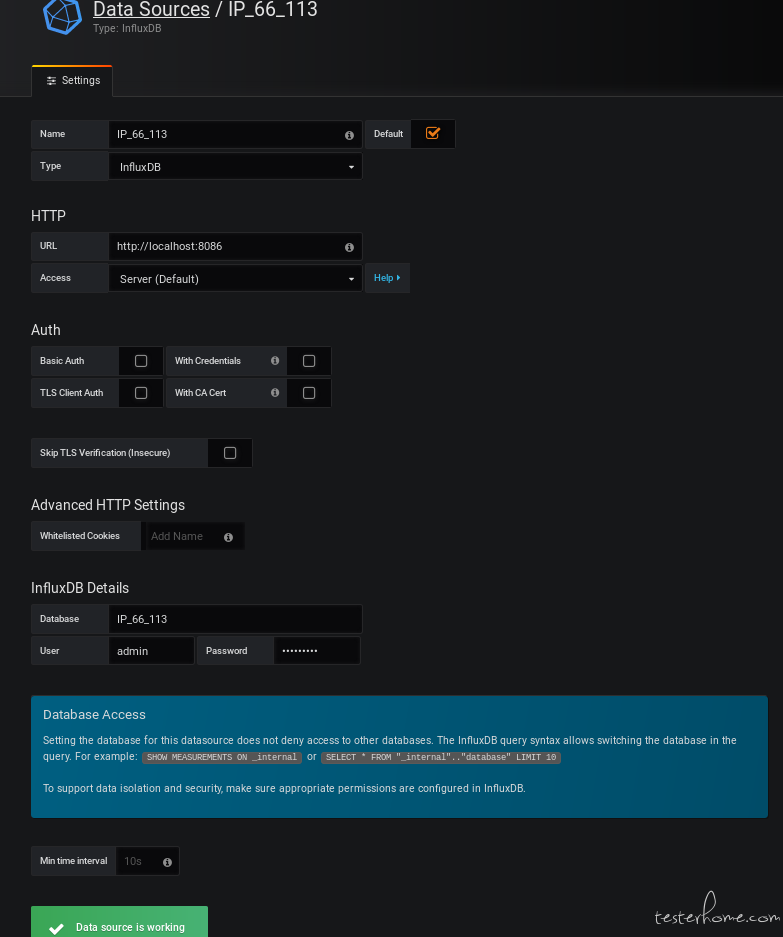
添加数据源类型 influxdb 的 IP_66_113 数据库 ,也就是 telegraf.conf 中配置为了记录 host 机硬件资源情况的。
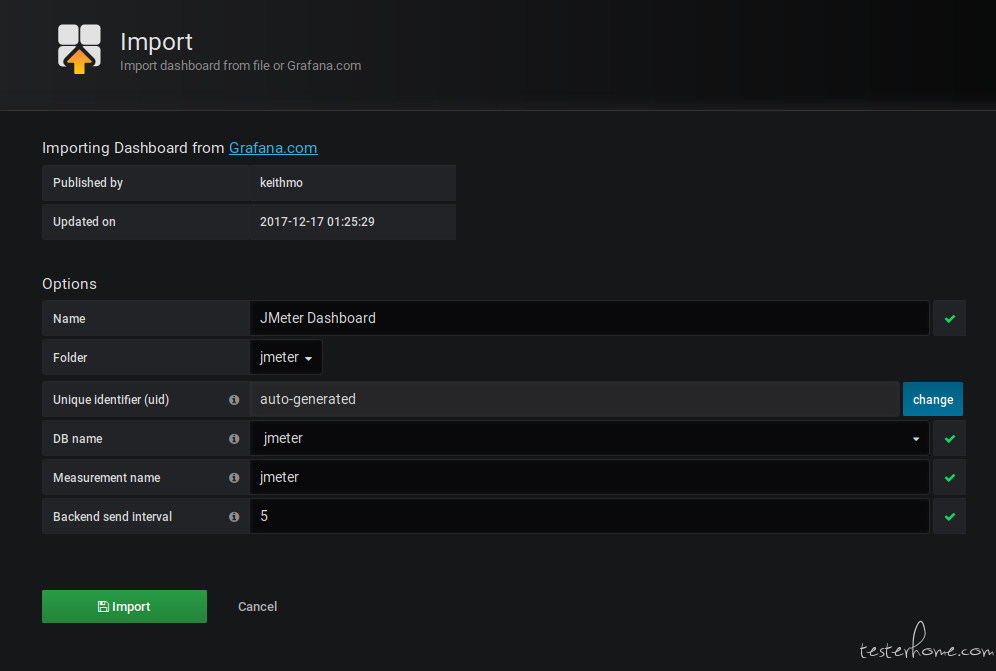
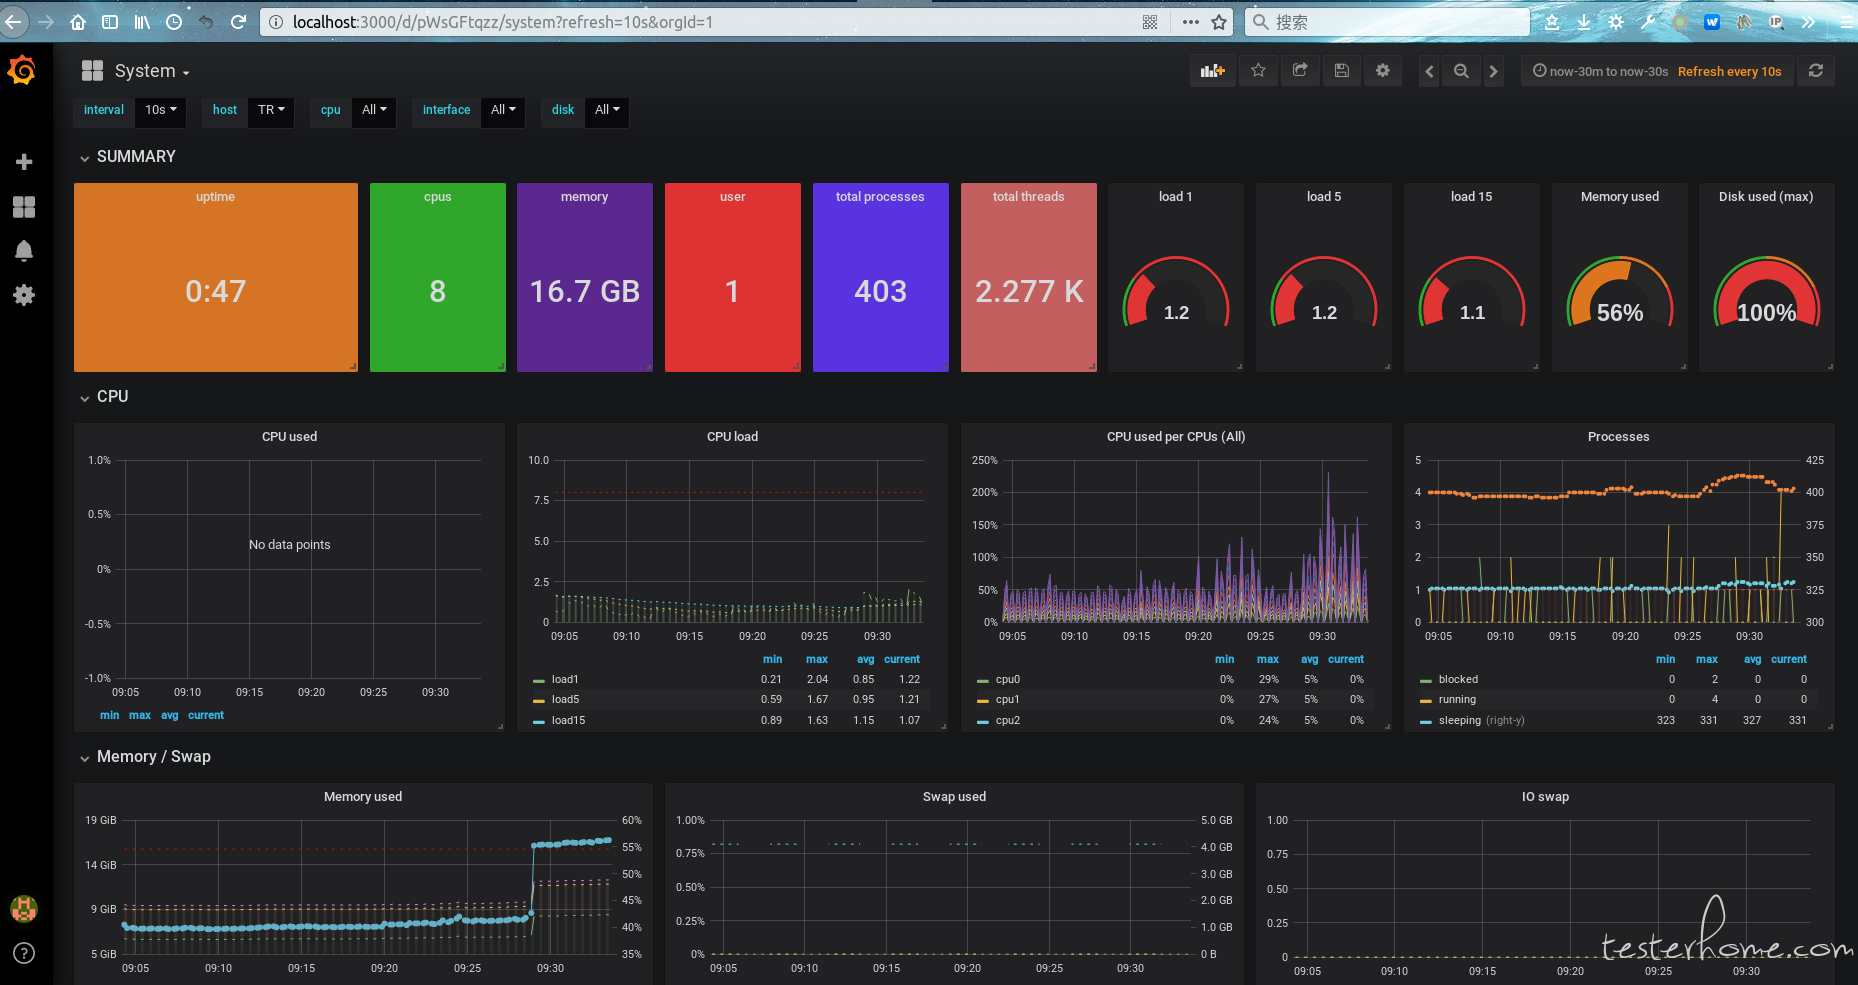
三 Grafana Dashboard 监控配置
Grafana import Dashboard 监控面板
导入前可以自行 create Folder jmeter 和 IP_66_113 以便于区分存储和记录,也注意选择需要存储的 DB name (jmeter 和 IP_66_113 )
一个是 监控 jmeter 负载情况的 https://grafana.com/dashboards/4026
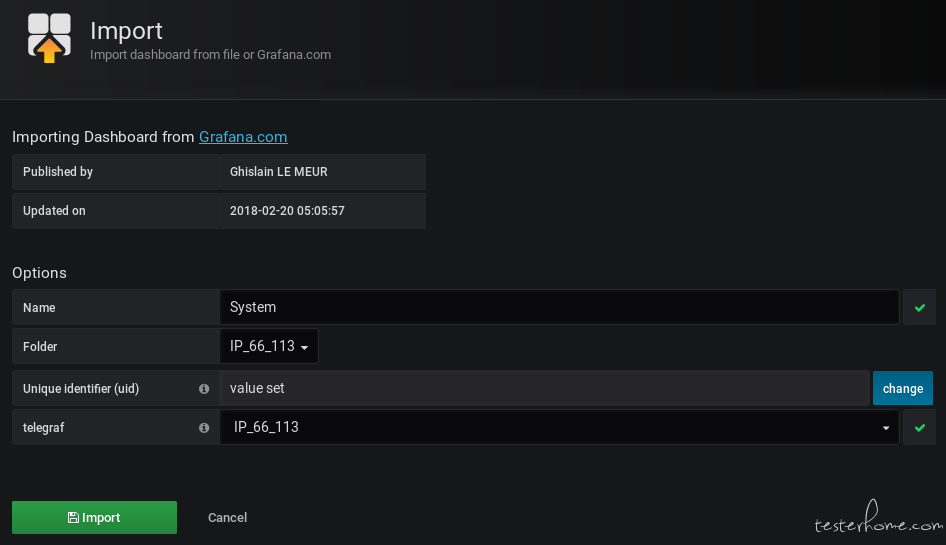
一个是 监控 host 硬件资源情况的 https://grafana.com/dashboards/3967 照着修改配置文件 telegraf.conf 内容
监控本机 host TR 硬件资源效果图
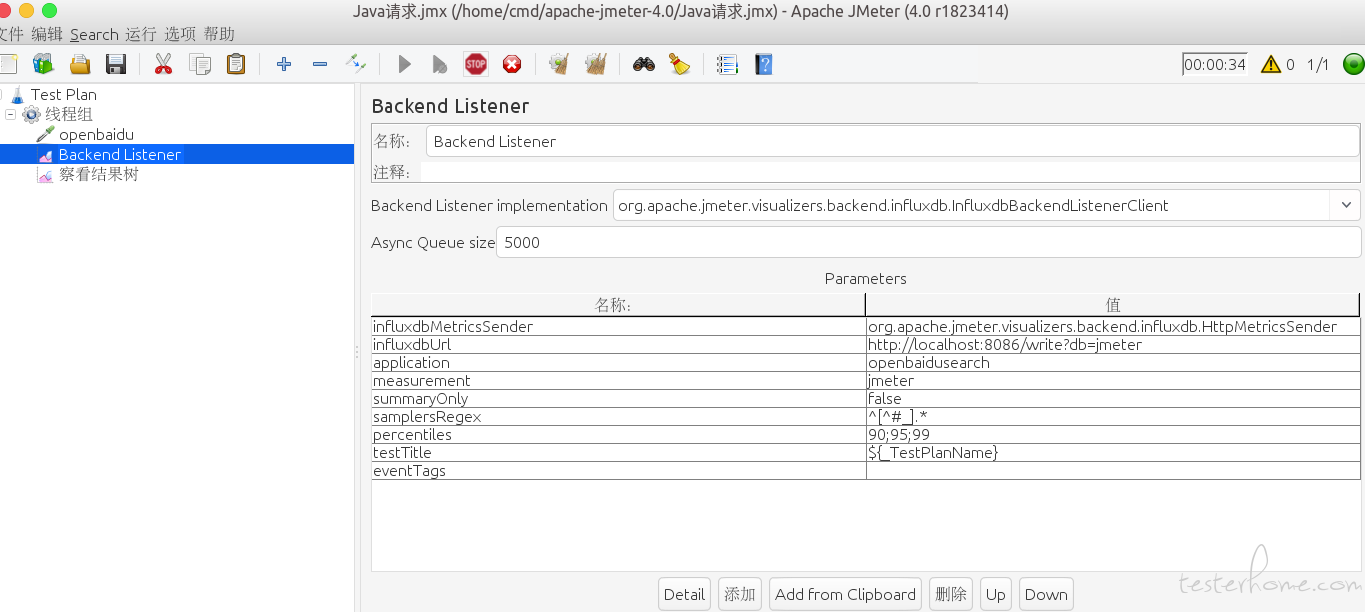
四 Jmeter BackendListerer 监控配置
配置 Jmeter BackendListerer
启动 jmeter4.0 随便设置个线程组 创建个 http 请求访问 baidu
BackendListerer 主要配置如下
如何确认 jmeter 可以被 influxdb 记录并监控了:
show measurements 看到 jmeter 相关字段的话即可
cmd@TR:~$ influx
Connected to http://localhost:8086 version 1.6.0
InfluxDB shell version: 1.6.0
> SHOW DATABASES
name: databases
name
----
telegraf
_internal
jmeter
IP_66_113
> USE jmeter
Using database jmeter
> show measurements
name: measurements
name
----
events
jmeter
jmeter.all.a.avg
jmeter.all.a.count
jmeter.all.a.max
jmeter.all.a.min
jmeter.all.a.pct90
jmeter.all.a.pct95
jmeter.all.a.pct99
jmeter.all.h.count
jmeter.all.ko.avg
...
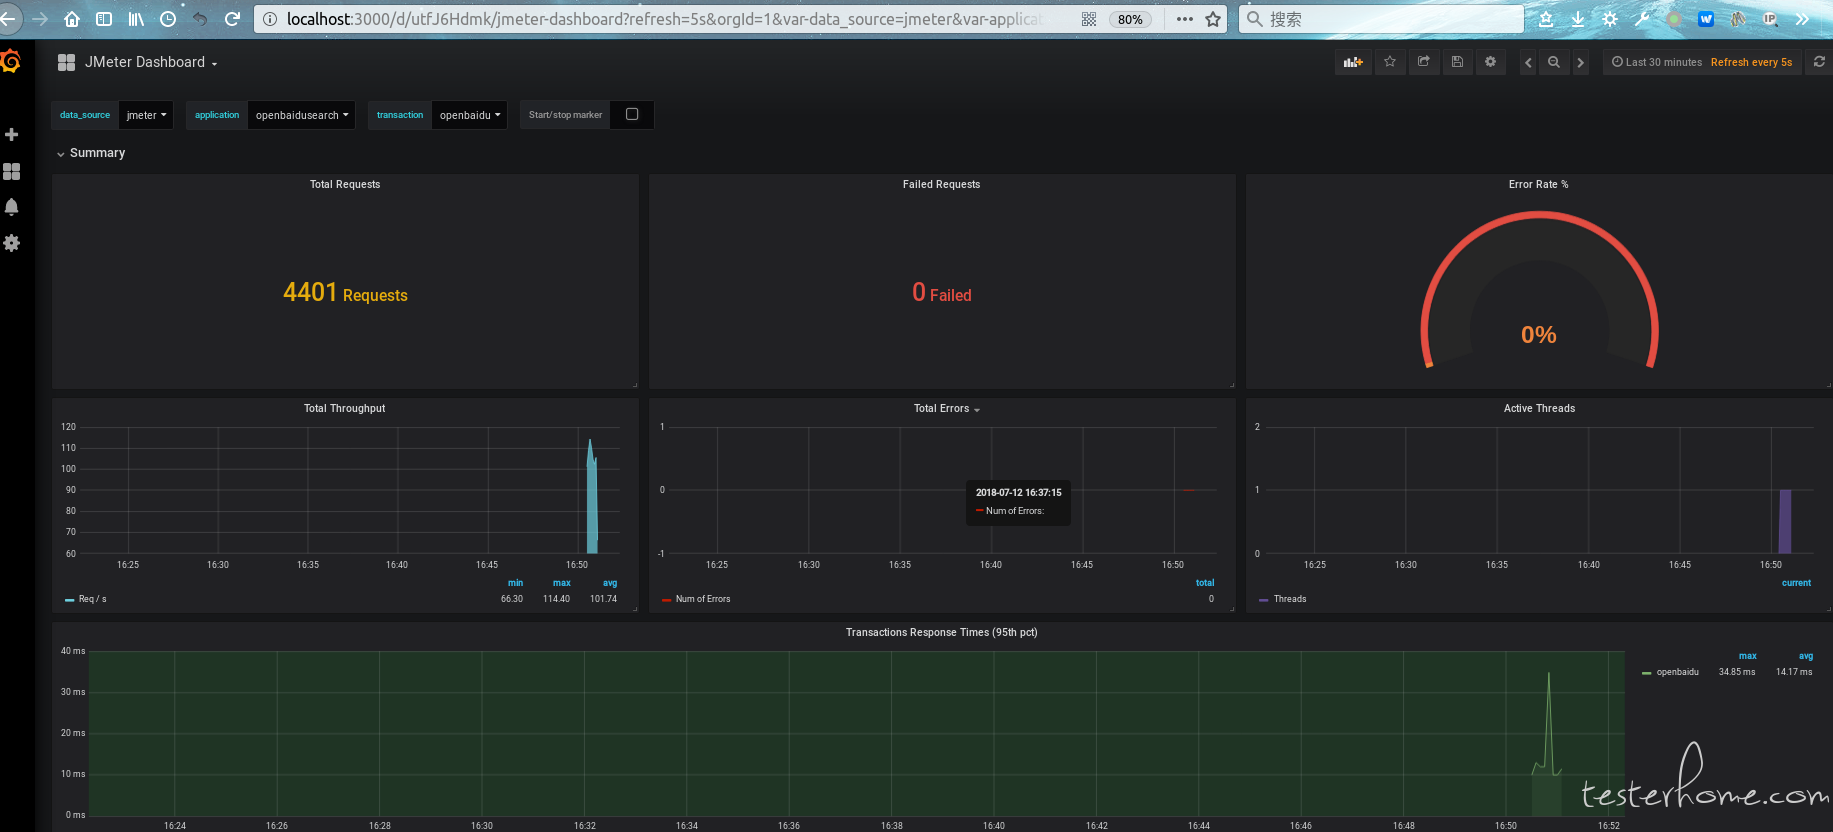
然后,可以线程组里设置些循环 ,然后启动执行该 testplan
Jmeter Dashboard 搜集负载情况监控数据效果图
 赞哦
赞哦