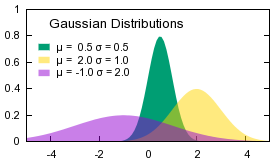
Gnuplot is a portable command-line driven graphing utility for Linux, OS/2, MS Windows, OSX, VMS, and many other platforms. The source code is copyrighted but freely distributed (i.e., you don't have to pay for it). It was originally created to allow scientists and students to visualize mathematical functions and data interactively, but has grown to support many non-interactive uses such as web scripting. It is also used as a plotting engine by third-party applications like Octave. Gnuplot has been supported and under active development since 1986.
总之来说就是支持 shell 和多平台的一个图形绘制工具
试着写个脚本验证下,首先在绘图之前,需要设置 terminal 是什么,terminal 表示输出到什么地方,是 shell,html,图片,还是 svg 等格式。通过如下的命令可以获取所有的支持格式。看起来很强大。不过目前只是为了在 shell 下统计,所以需要选择 dumb
gnuplot> set term

Available terminal types:
           canvas  HTML Canvas object
              cgm  Computer Graphics Metafile
          context  ConTeXt with MetaFun (for PDF documents)
          domterm  DomTerm terminal emulator with embedded SVG
             dumb  ascii art for anything that prints text
              dxf  dxf-file for AutoCad (default size 120x80)
            eepic  EEPIC -- extended LaTeX picture environment
              emf  Enhanced Metafile format
            emtex  LaTeX picture environment with emTeX specials
         epslatex  LaTeX picture environment using graphicx package
              fig  FIG graphics language for XFIG graphics editor
              gif  GIF images using libgd and TrueType fonts
             hpgl  HP7475 and relatives [number of pens] [eject]
             jpeg  JPEG images using libgd and TrueType fonts
            latex  LaTeX picture environment
              lua  Lua generic terminal driver
               mf  Metafont plotting standard
               mp  MetaPost plotting standard
             pcl5  HP Designjet 750C, HP Laserjet III/IV, etc. (many options)
              png  PNG images using libgd and TrueType fonts
       postscript  PostScript graphics, including EPSF embedded files (*.eps)
          pslatex  LaTeX picture environment with PostScript \specials
            pstex  plain TeX with PostScript \specials
         pstricks  LaTeX picture environment with PSTricks macros
              qms  QMS/QUIC Laser printer (also Talaris 1200 and others)
          sixelgd  sixel using libgd and TrueType fonts
              svg  W3C Scalable Vector Graphics
          tek40xx  Tektronix 4010 and others; most TEK emulators
          tek410x  Tektronix 4106, 4107, 4109 and 420X terminals
          texdraw  LaTeX texdraw environment
             tgif  TGIF X11 [mode] [x,y] [dashed] ["font" [fontsize]]
             tikz  TeX TikZ graphics macros via the lua script driver
         tkcanvas  Tk canvas widget
             tpic  TPIC -- LaTeX picture environment with tpic \specials
          unknown  Unknown terminal type - not a plotting device
            vttek  VT-like tek40xx terminal emulator
            xterm  Xterm Tektronix 4014 Mode
以下的所有脚本都必须先设置一个输出终端。比如输出到 shell,也可以输出到其他的格式
set terminal dumb
官网的一个小 demo,还挺不错

set title "Simple Plots" font ",20"
set key left box
set samples 50
set style data points

plot [-10:10] sin(x),atan(x),cos(atan(x))
别人写的示例:https://alvinalexander.com/technology/gnuplot-charts-graphs-examples
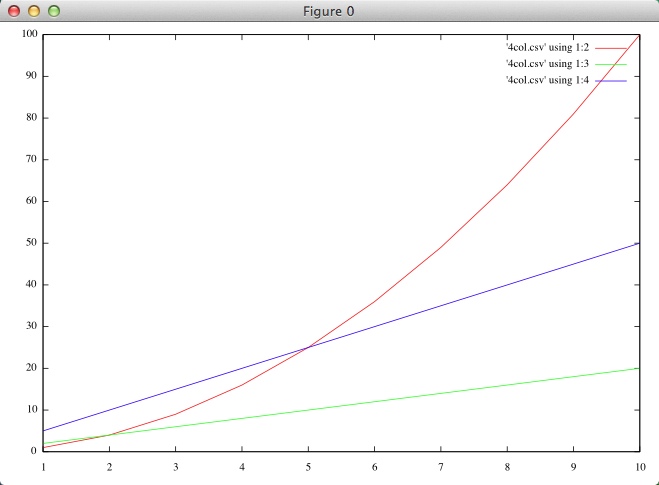
假设存在如下的 csv 文件
1,    1,   2,   5
2,    4,   4,  10
3,    9,   6,  15
4,   16,   8,  20
5,   25,  10,  25
6,   36,  12,  30
7,   49,  14,  35
8,   64,  16,  40
9,   81,  18,  45
10, 100,  20,  50
画图的代码是
plot '4col.csv' using 1:2 with lines, '4col.csv' using 1:3 with lines
plot '4col.csv' using 1:2 with lines, '4col.csv' using 1:3 with lines, '4col.csv' using 1:4 with lines
效果如下
假设存在如下的场景,我想在 shell 中统计下最近几年的一些热门关键词的趋势。比如 Appium Robotium Calabash Macaca。写个脚本测试下, 首先从 404 网站爬取数据,利用它提供的按照时间范围搜索,分别搜索 2008 到 2017 年的所有数据内容数量。
#写一个函数用于复用,根据时间得到关键词的索引量
google ()
{
    years=(`echo {2008..2018}`);
    count=${#years[*]};
    for ((i=0; i<count-1; i++))
    do
        index_count=$(curl --get  --data-urlencode "q=$1" --data-urlencode "tbs=cdr:1,cd_min:1/1/${years[i]},cd_max:1/1/${years[i+1]}"  'https://www.google.com/search'  -H 'accept-language: zh-CN,zh;q=0.9,en-US;q=0.8,en;q=0.7' -H 'user-agent: Mozilla/5.0 (Macintosh; Intel Mac OS X 10_13_1) AppleWebKit/537.36 (KHTML, like Gecko) Chrome/62.0.3202.94 Safari/537.36' -H 'accept: text/html,application/xhtml+xml,application/xml;q=0.9,image/webp,image/apng,*/*;q=0.8' | grep -o '找到约.*条结果' | awk '{print $2}' | sed 's#,##g' );
        echo ${years[i]}, $index_count;
    done
}
#并行查询加快进度
google "appium+android" | tee appium.csv &
google "robotium+android" | tee robotium.csv  &
google "calabash+android" | tee calabash.csv  &
google "macaca+android" | tee macaca.csv &
wait
#绘图
gnuplot -e "set term dumb; plot 'appium.csv' u 1:2 w l, 'robotium.csv' u 1:2 w l,'calabash.csv' u 1:2 w l, 'macaca.csv' u 1:2 w l"
结果如下
45000 +------------------------------------------------------------------+
      |      +       +      +       +      +       +      +       +     *|
40000 |-+                                     'appium.csv' u 1:2 *******-|
      |                                     'robotium.csv' u 1:2 ####### |
35000 |-+                                   'calabash.csv' u 1:2 $$$$$$$-|
      |                                       'macaca.csv' u 1:2 %%%%%%% |
      |                                                            *     |
30000 |-+                                                        **    +$|
      |                                                       ***      $ |
25000 |-+                                                   **         $-|
      |                                                   **          $  |
20000 |-+                                               **           $ +-|
      |                                               **            $    |
15000 |-+                                           **              $  +%|
      |                                           **               $  %% |
      |                                        ***            $$$$$ %%   |
10000 |-+                                    **        $$$$$$$  %%%%   +-|
      |                                 *****  $$$$$$$$     %%%%      ###|
 5000 |-+                ***************$$$$$$$########%%%%%########## +-|
      |   %%%%%%%%%%%$$$$%%%%%%%%%%%%%%%%%%%%%%%%%%%%%%   +       +      |
    0 +------------------------------------------------------------------+
     2008   2009    2010   2011    2012   2013    2014   2015    2016   2017
这样最起码不用再去 excel 或者 echat 里面去绘图了。简单做些自动化统计还是不错的。
顺便找找其他感兴趣的关键词做分析
#并行查询加快进度
google '"测试工程师"+招聘' | tee set.csv &
google '"测试开发工程师"+招聘' | tee sdet.csv &
google '测试+招聘+jmeter' | tee jmeter.csv &
google '测试+招聘+loadrunner' | tee loadrunner.csv &
google '测试+招聘+java' | tee java.csv &
google '测试+招聘+python' | tee python.csv &
wait
#绘图 u=using w=with l=lines 是gnuplot支持的简写格式
gnuplot -e "set term dumb;
plot 'sdet.csv' u 1:2 w l;
plot 'set.csv' u 1:2 w l;
plot 'jmeter.csv' u 1:2 w l, 'loadrunner.csv' u 1:2 w l;
plot 'java.csv' u 1:2 w l, 'python.csv' u 1:2 w l,
"
得到的结果如下
6000 +-------------------------------------------------------------------+
     |       +      +       +      +       +      +       +      +       |
     |                                          'sdet.csv' u 1:2 ******* |
5000 |-+                                                               +-|
     |                                                                  *|
     |                                                                 * |
     |                                                                *  |
4000 |-+                                                             * +-|
     |                                                               *   |
     |                                                              *    |
3000 |-+                                                           *   +-|
     |                                                            *      |
     |                                                          **       |
2000 |-+                                                      **       +-|
     |                                                      **           |
     |                                                  ****             |
     |                                              ****                 |
1000 |-+                                       *****                   +-|
     |                  ***********************                          |
     |   ***************    +      +       +      +       +      +       |
   0 +-------------------------------------------------------------------+
    2008    2009   2010    2011   2012    2013   2014    2015   2016    2017


70000 +------------------------------------------------------------------+
      |      +       +      +       +      +       +      +       +      |
      |                                          'set.csv' u 1:2 ******* |
60000 |-+                                                              +*|
      |                                                                * |
      |                                                                * |
50000 |-+                                                             *+-|
      |                                                              *   |
      |                                                             *    |
40000 |-+                                                           *  +-|
      |                                                            *     |
30000 |-+                                                        **    +-|
      |                                                       ***        |
      |                                                     **           |
20000 |-+                                                ***           +-|
      |                                              ****                |
      |                                        ******                    |
10000 |-+                               *******                        +-|
      |          ***********************                                 |
      |**********    +      +       +      +       +      +       +      |
    0 +------------------------------------------------------------------+
     2008   2009    2010   2011    2012   2013    2014   2015    2016   2017


5500 +-------------------------------------------------------------------+
     |       +      +       +      +       +      +       +      +       |
5000 |-+                                      'jmeter.csv' u 1:2 ********|
     |                                    'loadrunner.csv' u 1:2 ####### |
4500 |-+                                                            *  +-|
4000 |-+                                                          **   +#|
     |                                                           *    ## |
3500 |-+                                                       **   ## +-|
     |                                                       **   ##     |
3000 |-+                                                   **   ##     +-|
     |                                                   ** ####         |
2500 |-+                                              ***###           +-|
     |                                              **###                |
2000 |-+                                 #########**##                 +-|
     |                               ####    **** ##                     |
1500 |-+           ##################********                          +-|
1000 |-+       ####   ****                                             +-|
     |#########  *****                                                   |
 500 |***********                                                      +-|
     |       +      +       +      +       +      +       +      +       |
   0 +-------------------------------------------------------------------+
    2008    2009   2010    2011   2012    2013   2014    2015   2016    2017


350000 +-----------------------------------------------------------------+
       |      +       +      +      +       +      +      +       +      |
       |                                        'java.csv' u 1:2 ******* |
300000 |-+                                    'python.csv' u 1:2 #######*|
       |                                                                *|
       |                                                               * |
250000 |-+                                                            *+-|
       |                                                              *  |
       |                                                             *   |
200000 |-+                                                          *  +-|
       |                                                           *     |
150000 |-+                                                         *   +-|
       |                                                         **     #|
       |                                                      ***   #### |
100000 |-+                                                  **   ###   +-|
       |                                               *****  ###        |
       |                                        *******     ##           |
 50000 |-+                       ***************       #####           +-|
       |          ***************       ###############                  |
       |################################    +      +      +       +      |
     0 +-----------------------------------------------------------------+
      2008   2009    2010   2011   2012    2013   2014   2015    2016   2017
让我们看看这份有意思的数据
抛开上面各种不权威的结论,我也只是给大家演示下 gnuplot 工具的强大之处,觉得还是挺方便实用的工具,所以分享给大家。
