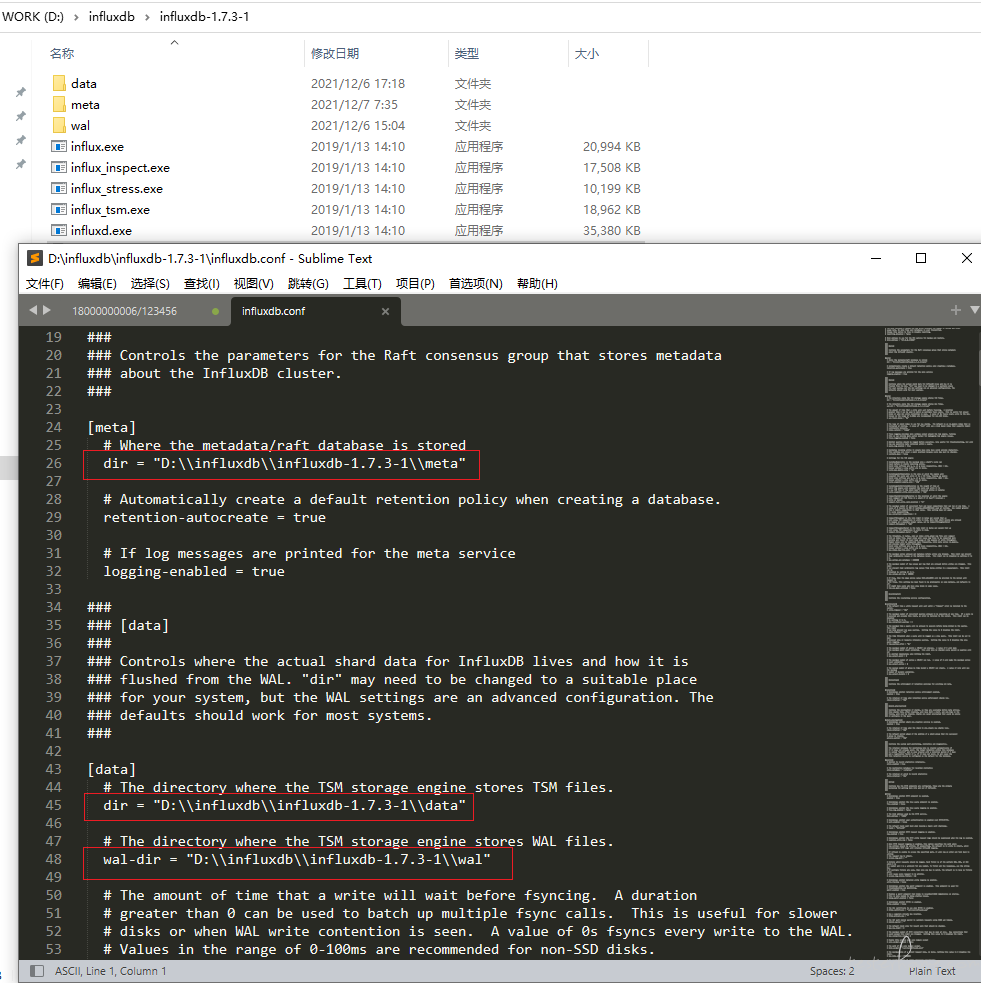

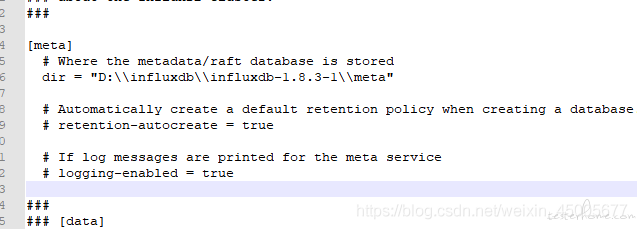


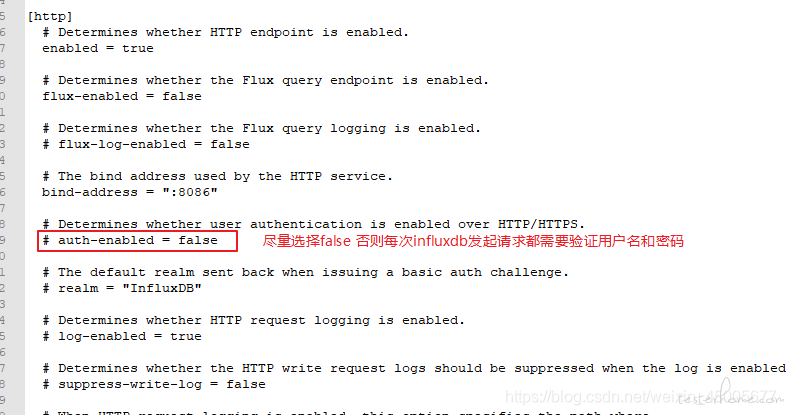

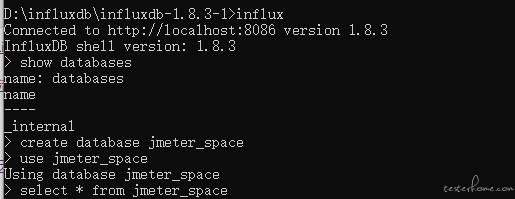
D:\influxdb\influxdb-1.8.3-1>influxd -config influxdb.conf


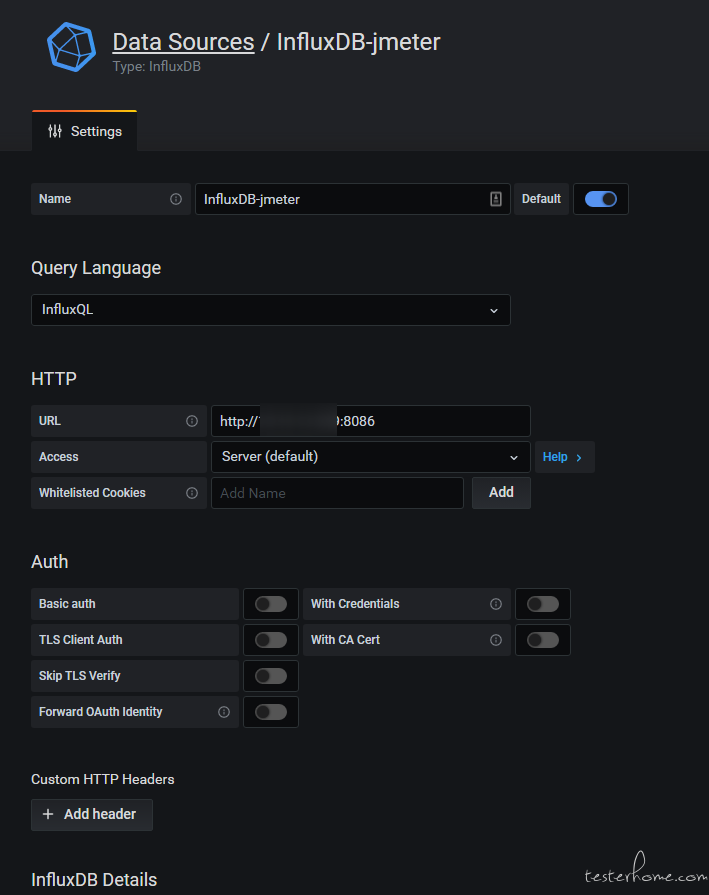
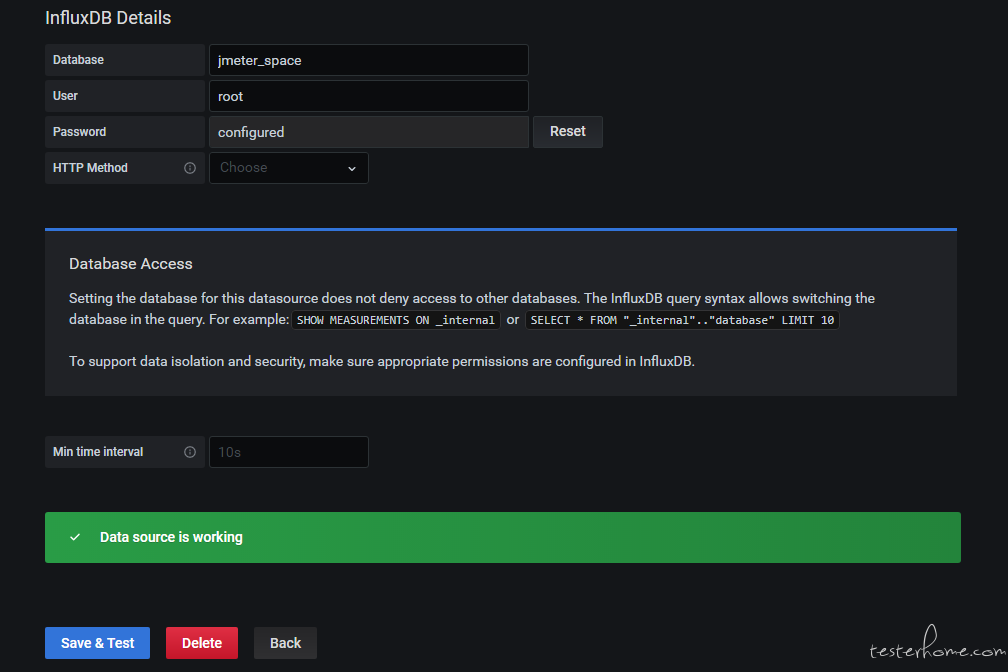


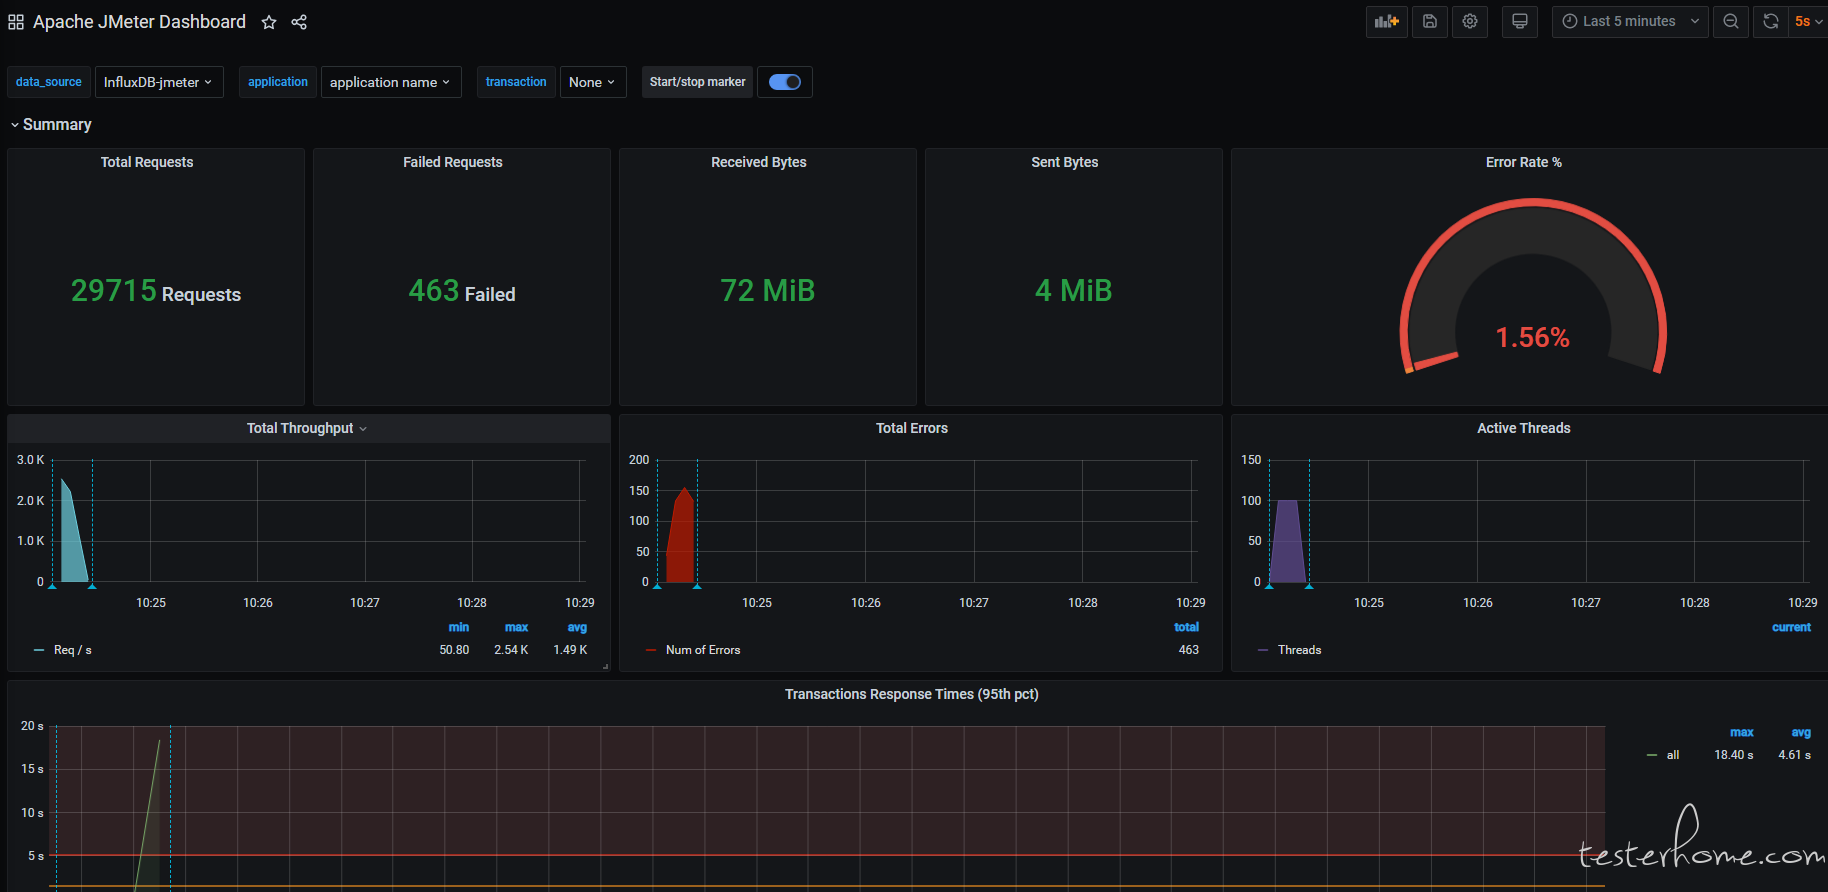
https://prometheus.io/download/

# my global config
global:
  scrape_interval: 15s # Set the scrape interval to every 15 seconds. Default is every 1 minute.
  evaluation_interval: 15s # Evaluate rules every 15 seconds. The default is every 1 minute.
  # scrape_timeout is set to the global default (10s).

# Alertmanager configuration
alerting:
  alertmanagers:
    - static_configs:
        - targets:
          # - alertmanager:9093

# Load rules once and periodically evaluate them according to the global 'evaluation_interval'.
rule_files:
  # - "first_rules.yml"
  # - "second_rules.yml"

# A scrape configuration containing exactly one endpoint to scrape:
# Here it's Prometheus itself.
scrape_configs:
  # The job name is added as a label `job=<job_name>` to any timeseries scraped from this config.
  - job_name: "prometheus"

    # metrics_path defaults to '/metrics'
    # scheme defaults to 'http'.

    static_configs:
      - targets: ["localhost:9090"]
上边注释已经很明确了:
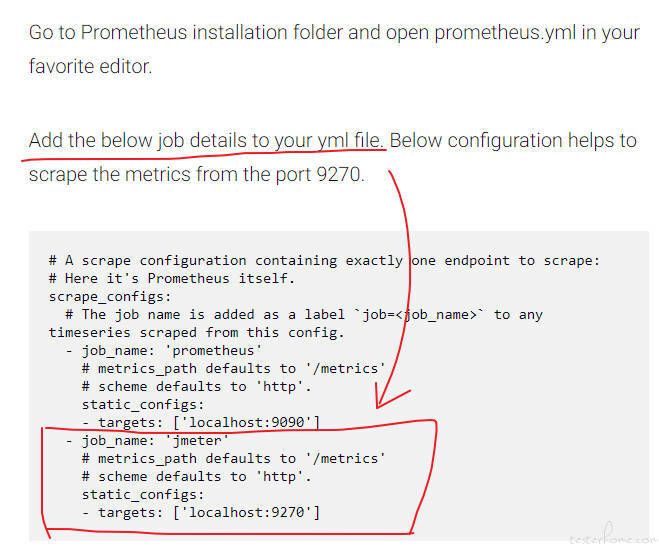
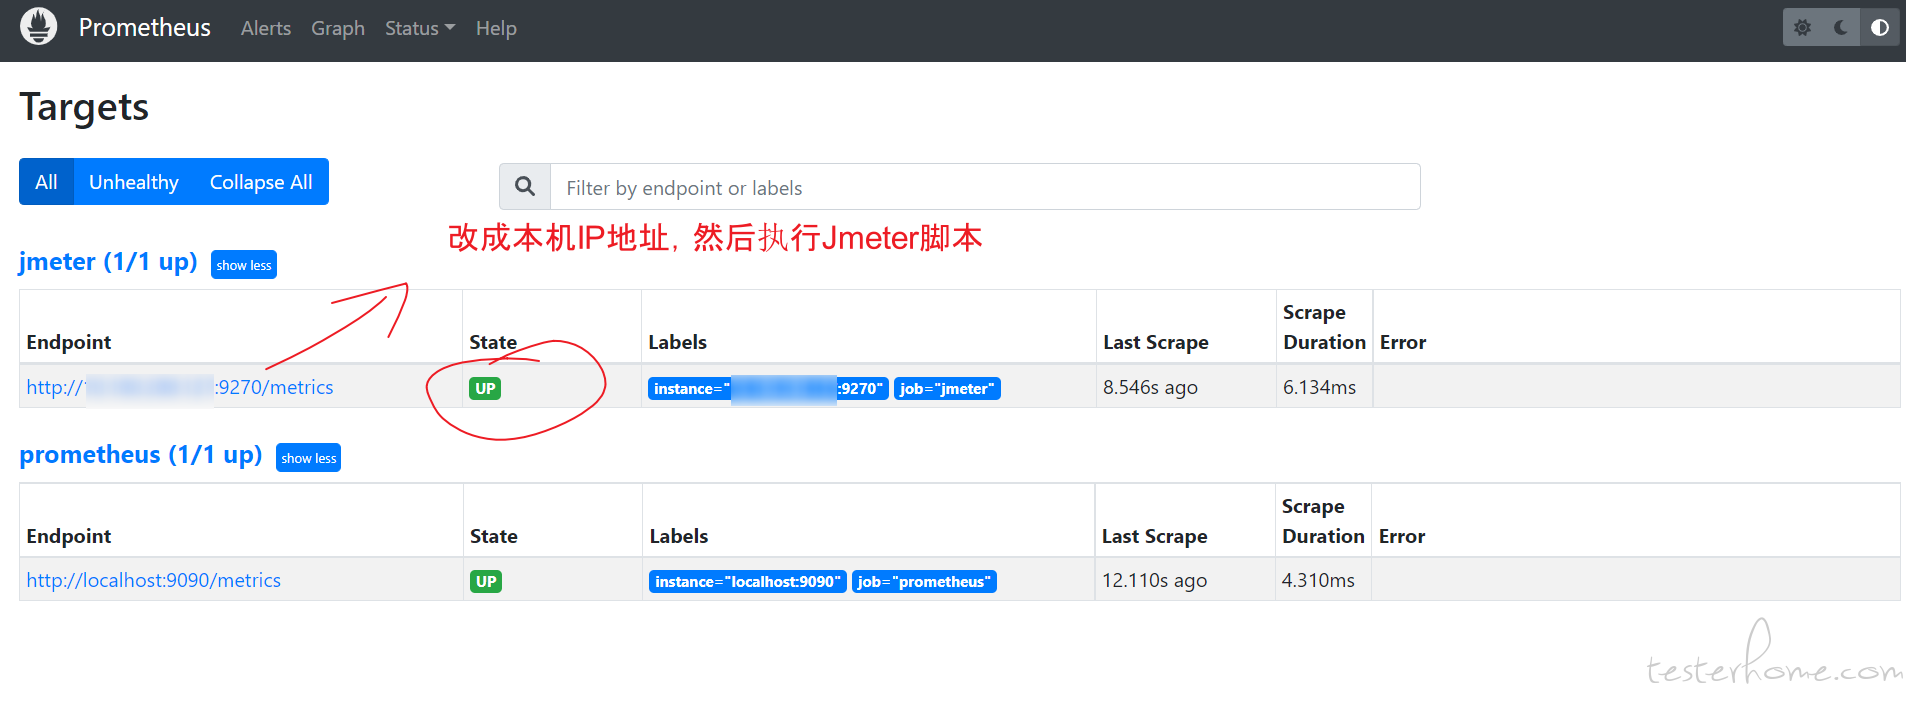
其中 job_name 表示抓取的任务名称,static_configs 表示该任务下的一些静态配置,targets 表示要抓取的地址,显然这块可以配置多个。
这个后边再研究,这里的默认配置就是监控 prometheus 本身。
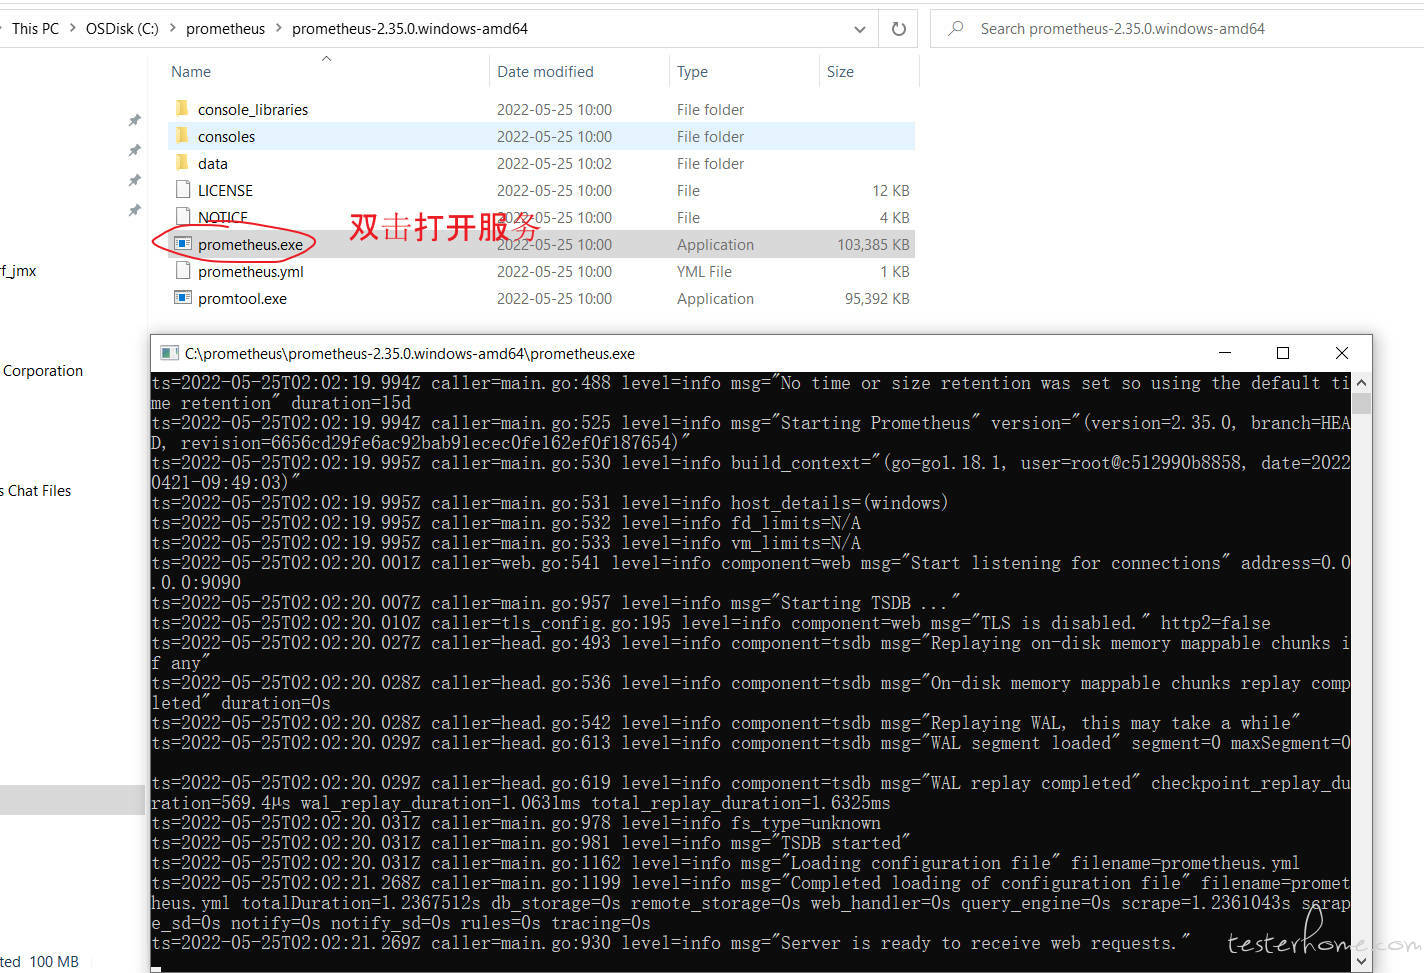

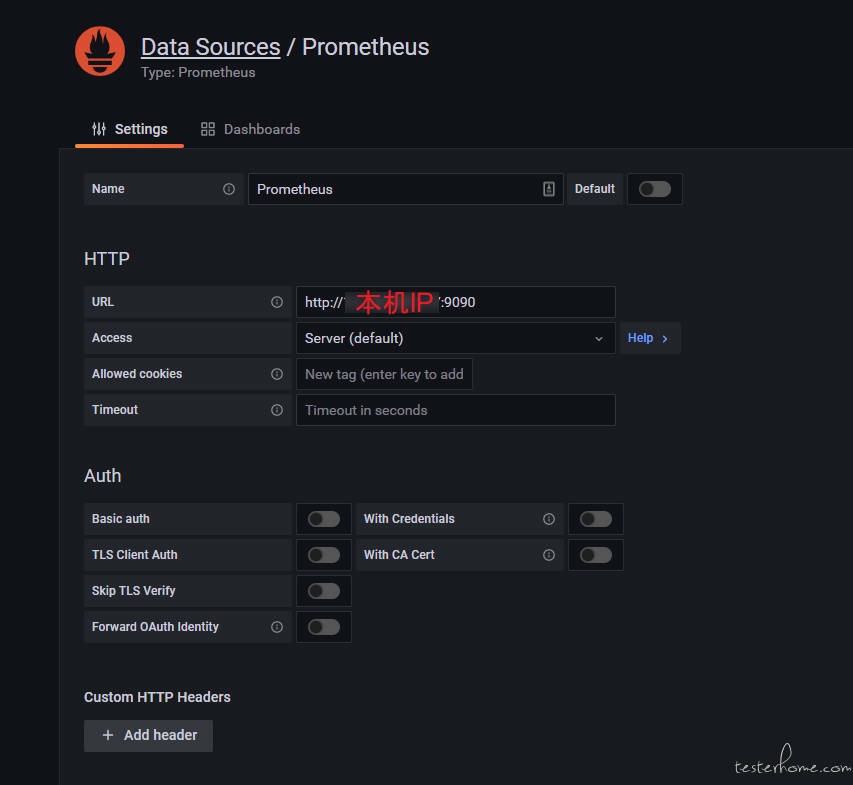
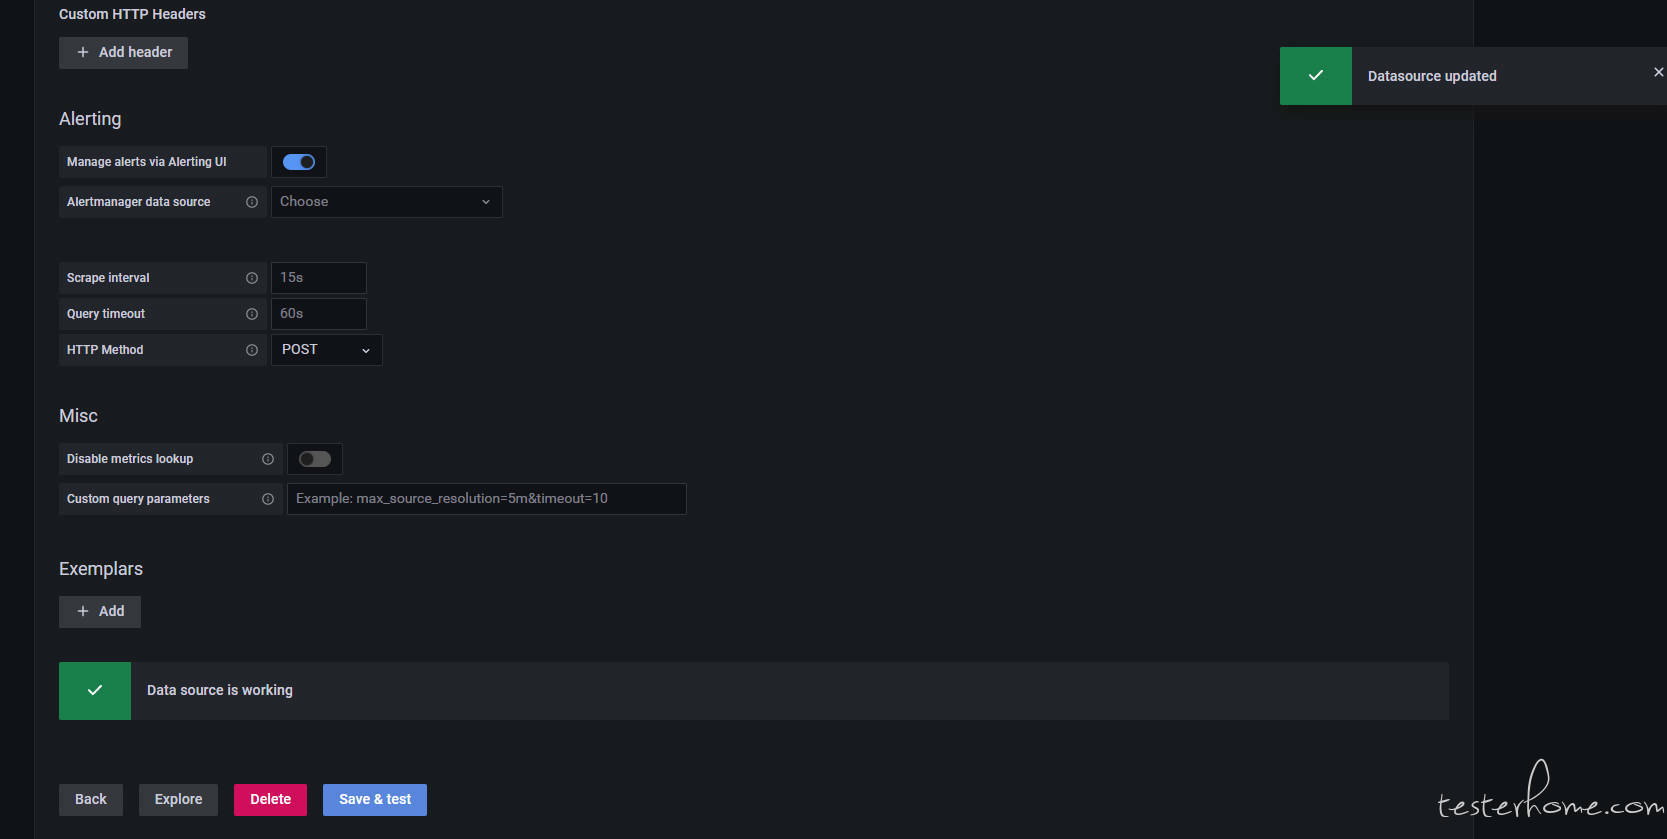
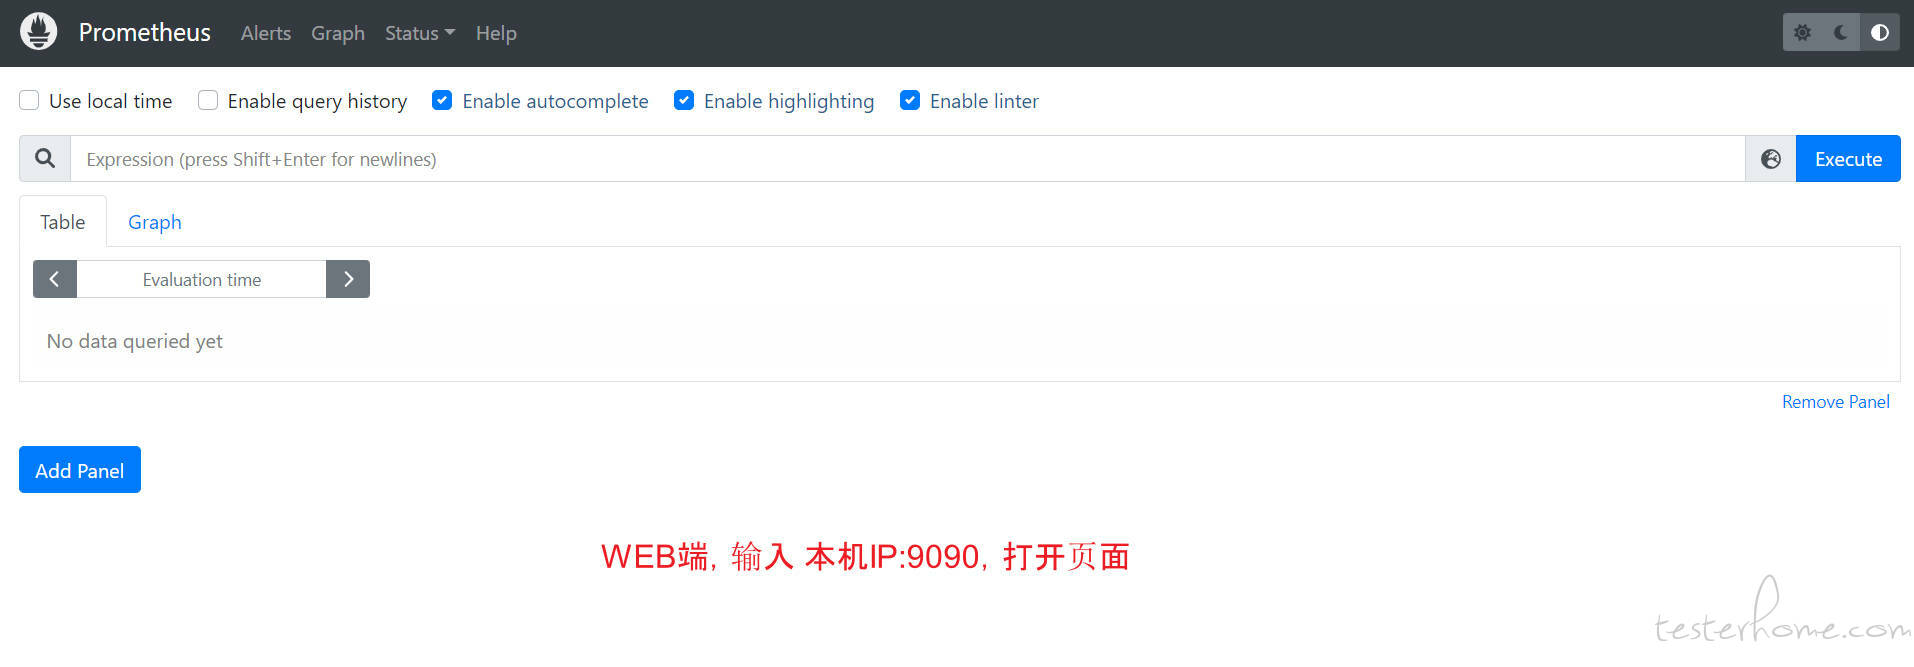


http://testerhome.com/topics/16548
https://blog.csdn.net/weixin_45005677/article/details/113342957
https://www.freesion.com/article/2160149721/
https://www.jianshu.com/p/20b867553654
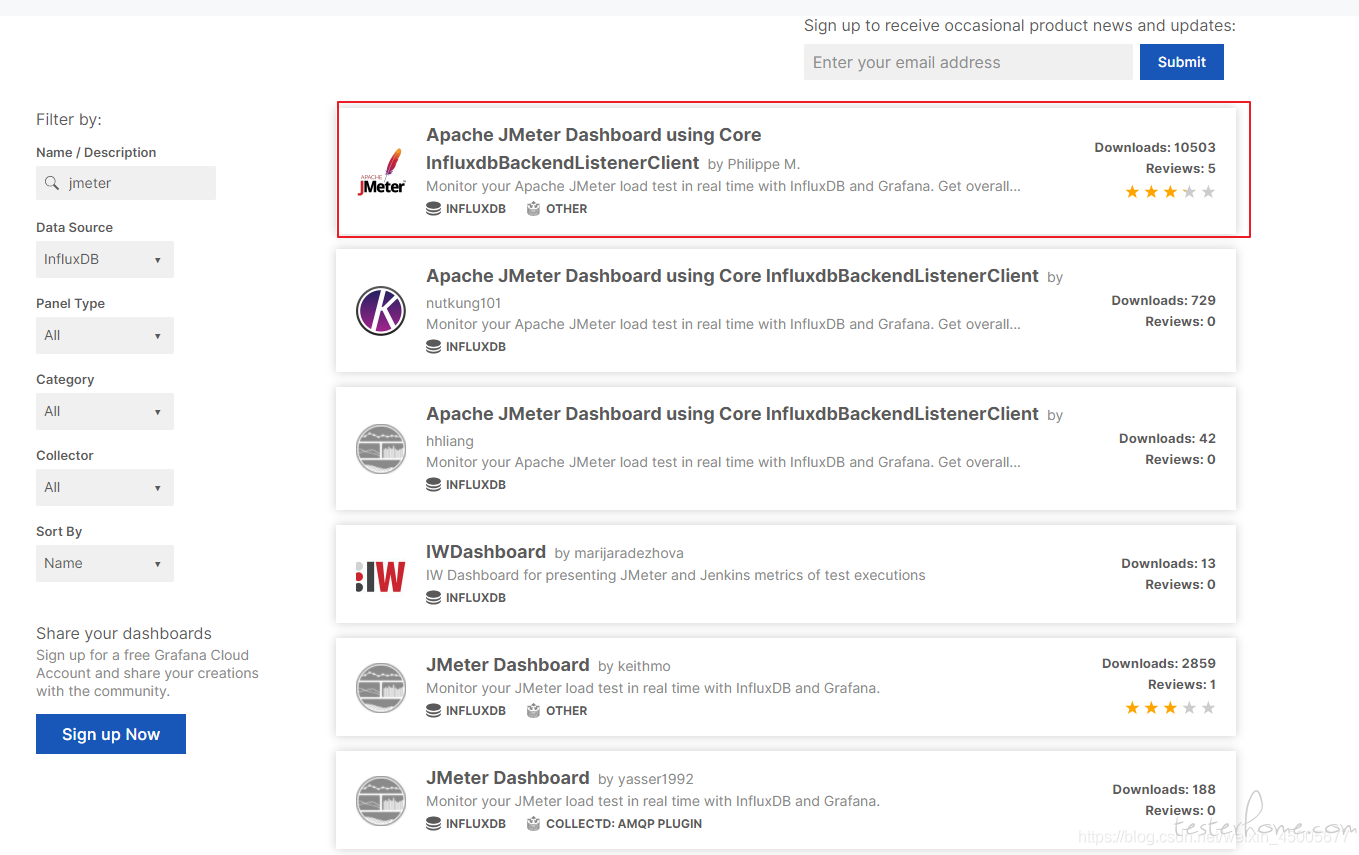
https://grafana.com/grafana/dashboards/?search=jmeter
https://www.jianshu.com/p/d2924790c69d
https://blog.csdn.net/tianjingle_blog/article/details/118005523
https://blog.csdn.net/yprufeng/article/details/116016858
https://qainsights.com/jmeter-prometheus-and-grafana-integration/
https://blog.csdn.net/weixin_39831902/article/details/111248462
https://blog.csdn.net/qq_38362419/article/details/108527506
https://blog.csdn.net/qq_25305833/article/details/122289483
https://testerhome.com/articles/22897
