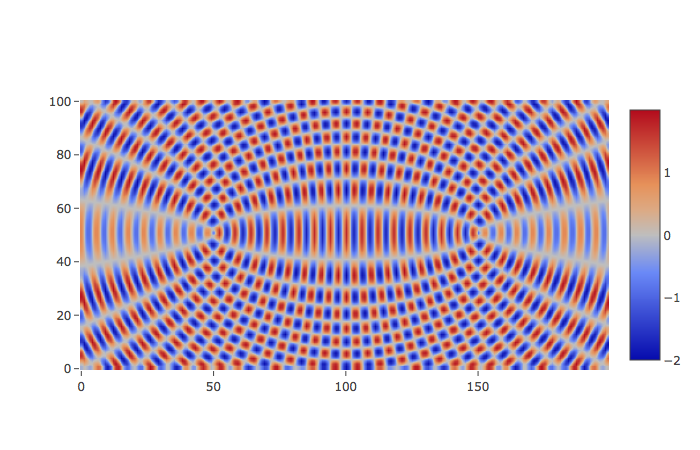
本人在学习使用 plotly 的 contour plots 制作的时候,发现利用这个表格制作波的干涉模拟方面有很不错的效果,因为之前被各种波动方程和振动方程教育了很久,所以就用波函数来开动,下面分享代码,供大家参考。(我用 java 写的代码模拟的波函数的测试数据)
下面是 plotly 的全部代码,里面包含了两种生成 contour plots 图表的方式,一个生成的是单个图表,但是带着等高线,所以被我放弃了。另外一个生成是图表矩阵,我选的 row=1,cols=1 的模式。
#!/usr/bin/python
# coding=utf-8

import plotly.plotly
from plotly.graph_objs import *
import plotly.graph_objs as go
import plotly.tools as tool

z = []
with open("/Users/Vicky/Documents/workspace/fission/long/intervene.log") as apidata:
    for i in apidata:
        data = i.split("\n")[0].split(",")
        z.append(data)
'''
#这是单独一个表格的情况,但没找到去掉等高线的方法
data = Data([
    Contour(
        z=z,
        contours = dict(
            coloring="heatmap"
        )
    )
])
plotly.offline.plot(data,filename="3333.html")
'''
data = {
    'z': z,
    'connectgaps': True,
    'type': 'heatmap',
    'zsmooth': 'best',
    'showscale': True
}
fig = tool.make_subplots(rows=1, cols=1)
fig.append_trace(data, 1, 1)
plotly.offline.plot(fig,filename= "3333.html")
下面是 java 生成数据的代码:
package practise;

import java.awt.Point;
import java.util.ArrayList;
import java.util.List;
import source.SourceCode;

public class Intervene extends SourceCode {
    public List<List<Double>> data = new ArrayList<>();

    public static void main(String[] args) {
        Intervene intervene = new Intervene();
        intervene.testDemo001();
    }

    public void testDemo001() {
        Point point1 = new Point(50, 50);
        Point point2 = new Point(150, 50);
        int lamda = 6;
        for (int i = 0; i < 100; i++) {// y 轴
            List<Double> distance = new ArrayList<>();
            for (int j = 0; j < 200; j++) {// x 轴
                Point point = new Point(j, i);
                double x = point.distance(point1) % lamda / lamda;
                double y = point.distance(point2) % lamda / lamda;
                double xx = Math.sin(x * 2 * Math.PI);
                double yy = Math.sin(y * 2 * Math.PI);
                distance.add(xx + yy);
            }
            data.add(distance);
        }
        StringBuffer content = new StringBuffer();
        int size = data.size();
        for (int i = 0; i < size; i++) {
            String text = data.get(i).toString();
            text = text.substring(1, text.length() - 1);
            if (i == 0)
                content.append(text);
            content.append(LINE + text);
        }
        logLong("intervene.log", content.toString());
    }
}
下面是生成图表:

